
Dairy Alternatives Market by Source (Almond, Coconut, Hemp, Rice, Oats, Soy, and Others), Application (Cheese, Creamers, Yogurt, Ice Creams, Milk and Others), Formulation (Plain and Flavored) and Geography – Global Forecast up to 2026
- March, 2021
- Domain: Chemicals, Materials & Food - Agro, Pharma, Food & Personal Care
- Get Free 10% Customization in this Report
Dairy alternatives are food and beverages that can be used as an auxiliary for dairy. These food and beverages are derivative from plants and are considered a very healthy alternative to dairy. Rice milk and Soy milk are among the most popular choice for dairy alternatives internationally, with significant demand for almond milk. Dairy alternatives are considered healthy due to the presence of several essential vitamins and minerals. These alternatives are also low on fats, cholesterol and have zero concentration of lactose. Dairy Alternatives have been very popular in the mature and developing market. This can be credited to an increase in the number of people allergic to dairy. Moreover, rising health awareness and disposable income have helped the dairy alternatives market development. Additionally, the introduction of healthy ingredients by different market players are some other factors that further drive the development of the market. But fluctuating prices of raw materials and high-cost act as the major restraint for this market. Growing flavored health drinks demand among the young population alongside its high nutritional values is the key factor in improving global industry development. The rising rate of obesity, diabetes, cardiovascular, and gastrointestinal diseases alongside growing consumer spending on healthy food products will drive the need for essential nutrition, lactose, calories, and sugar-free food products.
Research Methodology:
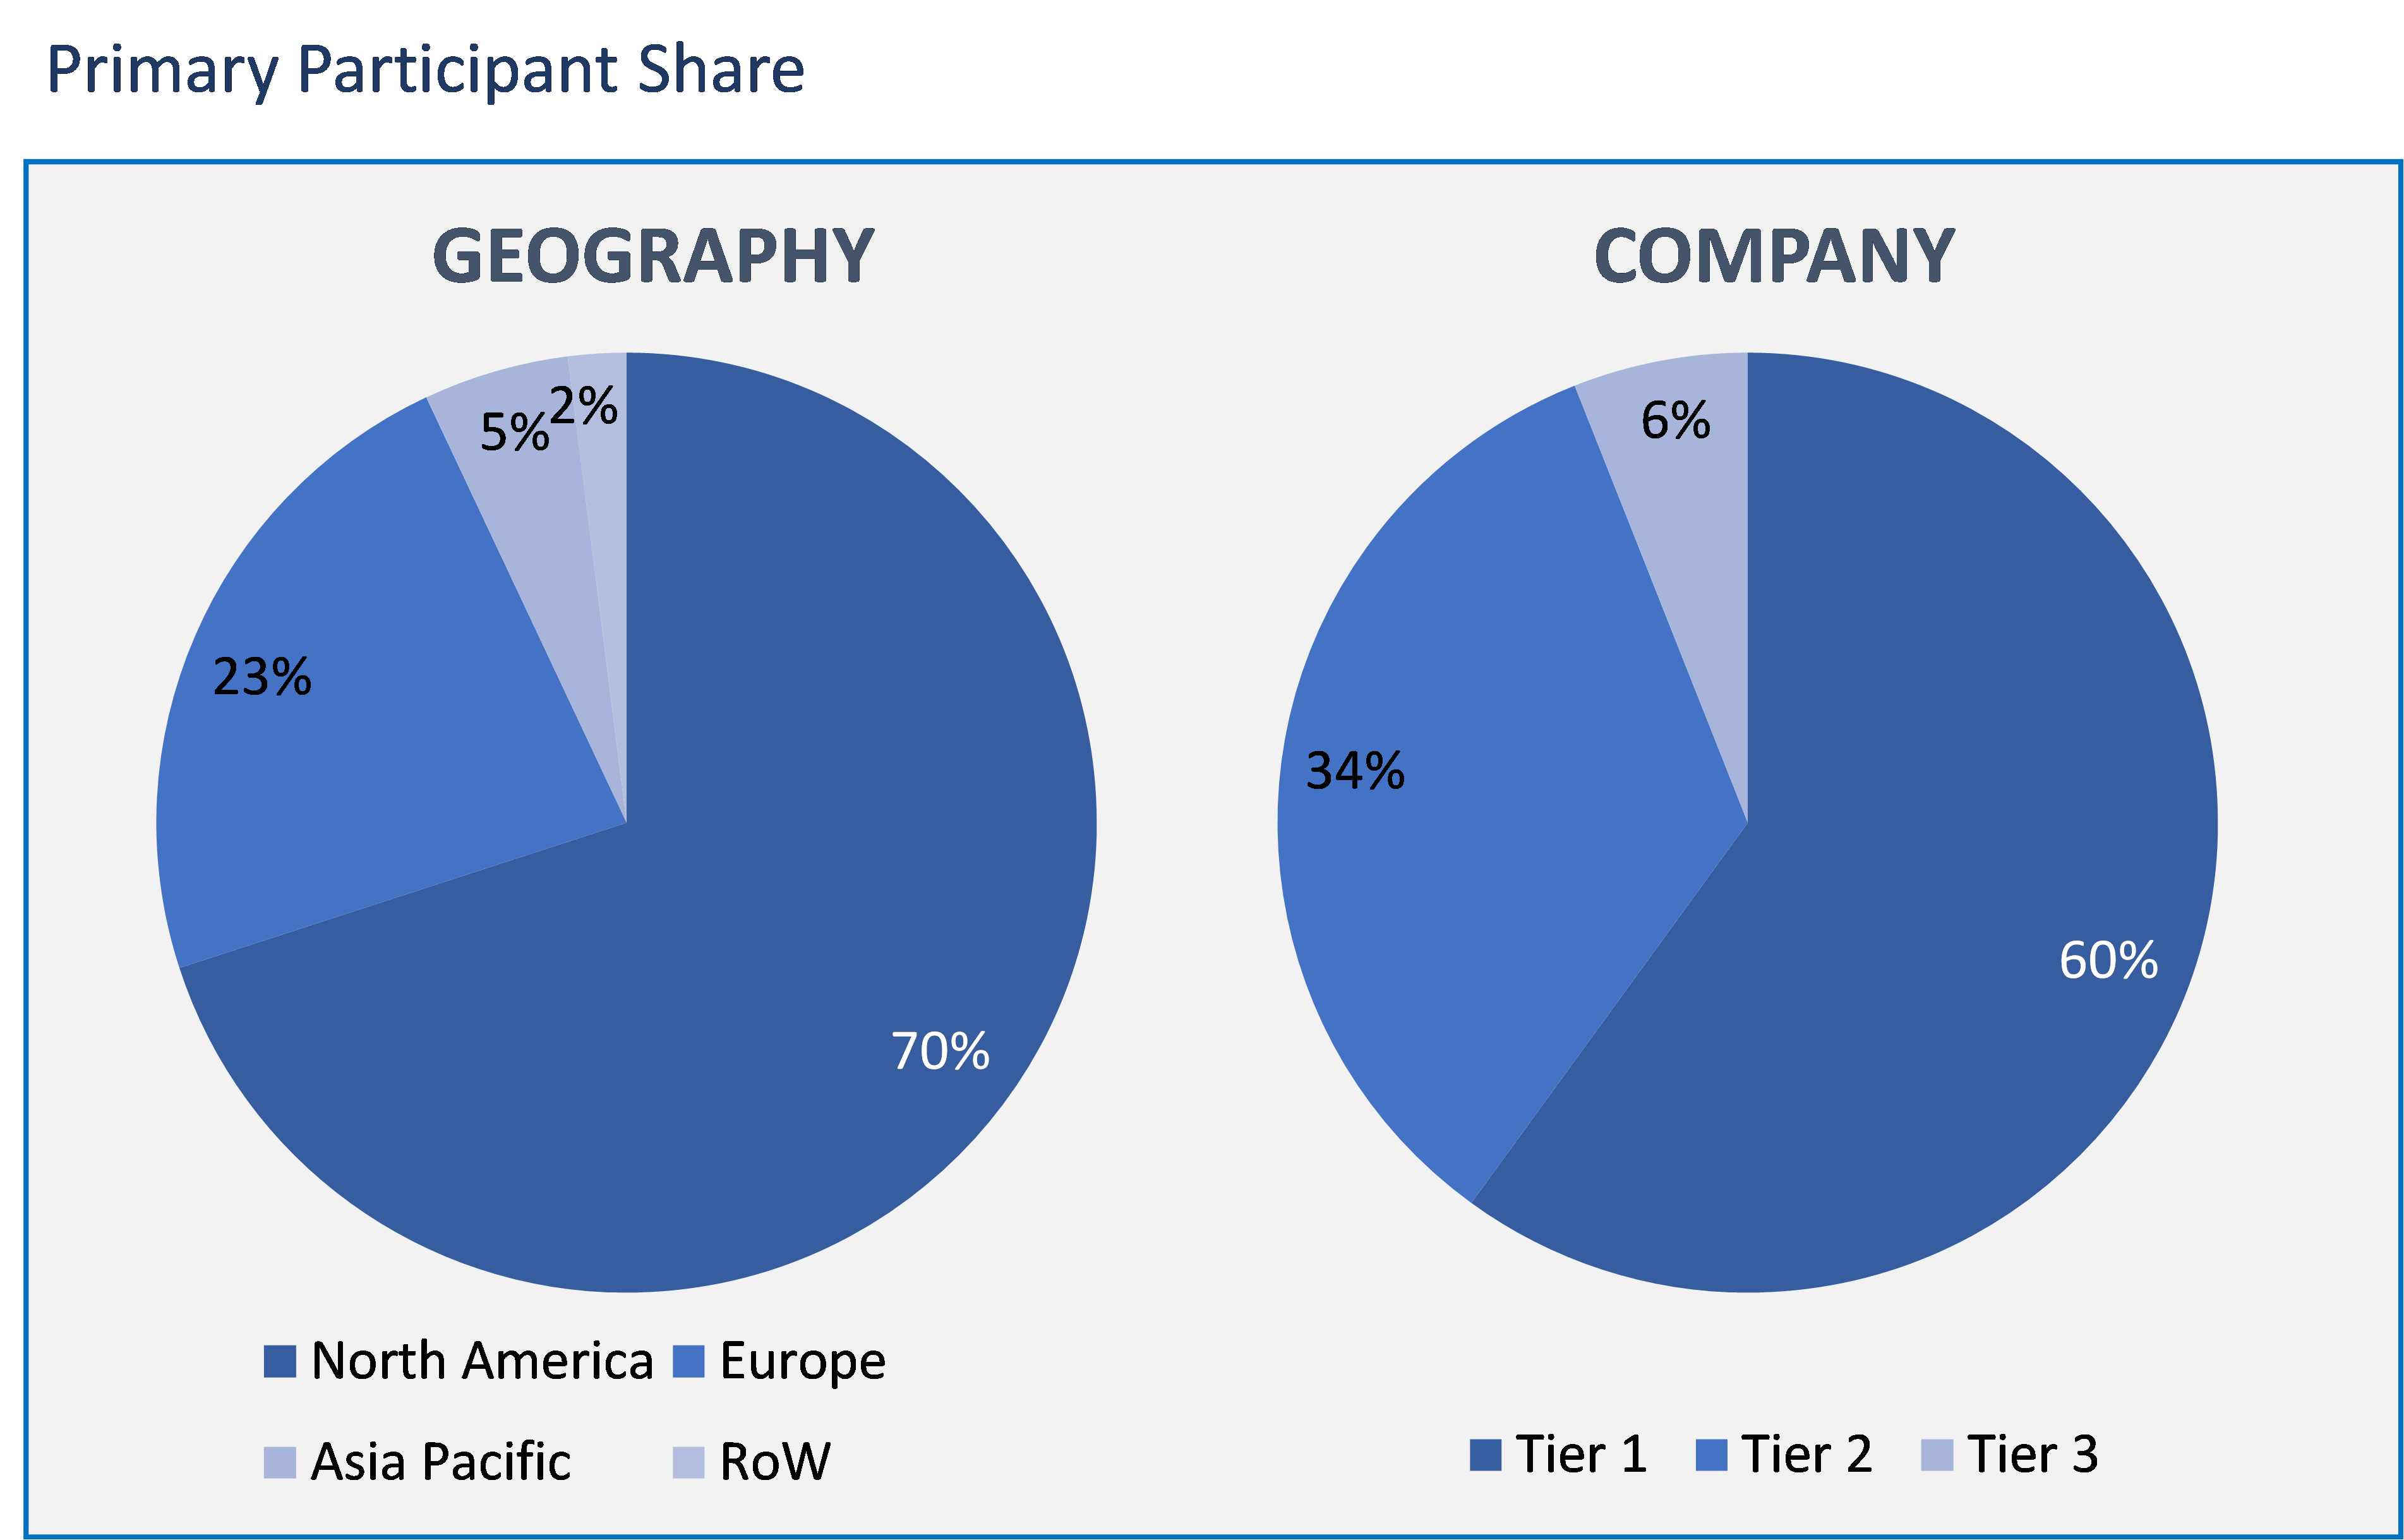
The dairy alternatives market has been analyzed by utilizing the optimum combination of secondary sources and in-house methodology, along with an irreplaceable blend of primary insights. The real-time assessment of the market is an integral part of our market sizing and forecasting methodology. Our industry experts and panel of primary participants have helped in compiling relevant aspects with realistic parametric estimations for a comprehensive study. The participation share of different categories of primary participants is given below:
Dairy Alternatives Market by Source
- Almond
- Soy
- Oats
- Hemp
- Coconut
- Rice
- Others
Dairy Alternatives Market by Application
- Cheese
- Creamers
- Yogurt
- Ice Creams
- Milk
- Others
Dairy Alternatives Market by Formulation
- Plain
- Flavored
Dairy Alternatives Market by Geography
- North America
- Europe
- Asia Pacific
- Rest of the World
As per source segmentation, the diary alternatives market has been divided into almond, soy, oats, hemp, coconut, rice, and others. Among them, soy-sourced dairy products are the most popular as the soy has a wide variety of milk products similar to cow and buffalo milk. Moreover, soy milk products contain more protein, vitamins, minerals, antioxidants, and have low cholesterol compared to almost all other sources, including cow and buffalo milk.
Among all applications, milk is the major segment to have a maximum share in the market. Prioritizing to the health consumers are more concerned about choosing the beverages. The high demand for milk extracted from non-dairy ingredients such as almond, coconut, soy, and other non-dairy ingredients is rapidly increasing. Health concerns associated with lactose intolerance and the busy lifestyles of working middle-class people are driving the non-dairy milk application.
In terms of formulation, the market is segmented into plain and flavored. The plain segment has acquired a maximum share in the dairy alternatives market. This is due to the increasing demand for plain unflavored milk, which is unsweetened. Due to increasing preference for low-calorie products among the 40+ age population, it is boosting the demand for plain milk.
The dairy alternatives market's geographical regions are North America, Europe, Asia Pacific, and the Rest of the World. The Asia Pacific has a major contribution in the market share due to the drastic urbanization, diversification in diet, increase in the per capita income of the population in this region.
Furthermore, the significant factors stimulating the global dairy alternatives are the increasing population suffering from allergic reactions to dairy products. Additionally, the increasing concerns about the health and benefits of non-dairy products are supporting the extreme demand for dairy alternative products.
The White Wave Foods Company, Blue Diamond Growers, Green Spot Co., Ltd, Freedom Foods Group Limited, Earth’s Own Food Company Inc., Hain Celestial, SunOpta, Ecomil, Sanitarium, Eden Foods Inc., Triballat Noyal, Valsoia SpA, Dohler, Panos Brands, Hiland Dairy, Ripple Foods, and Califia Farms are the few notable companies of dairy alternatives market.
As a result, these dairy alternative products have a crucial role in daily life since milk and other milk products are essential and have a major contribution to protein supplements. Moreover, compared to the usual dairy products, these products are less in cholesterol and more beneficial.
- The report gives the overall perception of the market growth factors and other factors which are positively and negatively impacting the market growth.
- This study explains every segment and sub-segments of the market and their contribution to market growth.
- Further, this report gives an analysis of the forthcoming trends and preferences of the consumers of the market.
- The in-depth insights are offered about the key vendors of the market in terms of their dynamic strategies, new products launched, and expansion of the business.
- Executive Summary
- Industry Outlook
- Industry Overview
- Industry Trends
- Market Snapshot
- Market Definition
- Market Outlook
- Porter Five Forces
- Related Markets
- Market characteristics
- Market Overview
- Market Segmentation
- Market Dynamics
- Drivers
- Restraints
- Opportunities
- DRO - Impact Analysis
- Source: Market Size & Analysis
- Overview
- Almond
- Soy
- Oats
- Hemp
- Coconut
- Rice
- Others
- Application: Market Size & Analysis
- Overview
- Cheese
- Creamers
- Yogurt
- Ice Creams
- Milk
- Others
- Formulation: Market Size & Analysis
- Overview
- Plain
- Flavored
- Geography: Market Size & Analysis
- Overview
- North America
- Europe
- Asia Pacific
- Rest of the World
- Competitive Landscape
- Competitor Comparison Analysis
- Market Developments
- Mergers and Acquisitions, Legal, Awards, Partnerships
- Product Launches and execution
- Vendor Profiles
- The White Wave Foods Company
- Overview
- Financial Overview
- Product Offerings
- Developments
- Business Strategy
- Blue Diamond Growers
- Overview
- Financial Overview
- Product Offerings
- Developments
- Business Strategy
- Green Spot Co., Ltd
- Overview
- Financial Overview
- Product Offerings
- Developments
- Business Strategy
- Freedom Foods Group Limited
- Overview
- Financial Overview
- Product Offerings
- Developments
- Business Strategy
- Earth’s Own Food Company Inc
- Overview
- Financial Overview
- Product Offerings
- Developments
- Business Strategy
- Hain Celestial
- Overview
- Financial Overview
- Product Offerings
- Developments
- Business Strategy
- SunOpta
- Overview
- Financial Overview
- Product Offerings
- Developments
- Business Strategy
- Ecomil
- Overview
- Financial Overview
- Product Offerings
- Developments
- Business Strategy
- Sanitarium
- Overview
- Financial Overview
- Product Offerings
- Developments
- Business Strategy
- Eden Foods Inc
- Overview
- Financial Overview
- Product Offerings
- Developments
- Business Strategy
- The White Wave Foods Company
- Companies to Watch
- Triballat Noyal
- Overview
- Products & Services
- Business Strategy
- Valsoia SpA
- Overview
- Products & Services
- Business Strategy
- Dohler
- Overview
- Products & Services
- Business Strategy
- Panos Brands
- Overview
- Products & Services
- Business Strategy
- Hiland Dairy
- Overview
- Products & Services
- Business Strategy
- Ripple Foods
- Overview
- Products & Services
- Business Strategy
- Califia Farms
- Overview
- Products & Services
- Business Strategy
- Triballat Noyal
- Analyst Opinion
- Annexure
- Report Scope
- Market Definitions
- Research Methodology
- Data Collation and In-house Estimation
- Market Triangulation
- Forecasting
- Report Assumptions
- Declarations
- Stakeholders
- Abbreviations
TABLE 1. GLOBAL DAIRY ALTERNATIVES MARKET VALUE, BY SOURCE, 2020-2026 (USD BILLION)
TABLE 2. GLOBAL DAIRY ALTERNATIVES MARKET VALUE FOR ALMOND, BY GEOGRAPHY, 2020-2026 (USD BILLION)
TABLE 3. GLOBAL DAIRY ALTERNATIVES MARKET VALUE FOR SOY, BY GEOGRAPHY, 2020-2026 (USD BILLION)
TABLE 4. GLOBAL DAIRY ALTERNATIVES MARKET VALUE FOR OATS, BY GEOGRAPHY, 2020-2026 (USD BILLION)
TABLE 5. GLOBAL DAIRY ALTERNATIVES MARKET VALUE FOR HEMP, BY GEOGRAPHY, 2020-2026 (USD BILLION)
TABLE 6. GLOBAL DAIRY ALTERNATIVES MARKET VALUE FOR COCONUT, BY GEOGRAPHY, 2020-2026 (USD BILLION)
TABLE 7. GLOBAL DAIRY ALTERNATIVES MARKET VALUE FOR RICE, BY GEOGRAPHY, 2020-2026 (USD BILLION)
TABLE 8. GLOBAL DAIRY ALTERNATIVES MARKET VALUE FOR OTHERS, BY GEOGRAPHY, 2020-2026 (USD BILLION)
TABLE 9. GLOBAL DAIRY ALTERNATIVES MARKET VALUE, BY APPLICATION, 2020-2026 (USD BILLION)
TABLE 10. GLOBAL DAIRY ALTERNATIVES MARKET VALUE FOR SLICES, BY GEOGRAPHY, 2020-2026 (USD BILLION)
TABLE 11. GLOBAL DAIRY ALTERNATIVES MARKET VALUE FOR CREAMERS, BY GEOGRAPHY, 2020-2026 (USD BILLION)
TABLE 12. GLOBAL DAIRY ALTERNATIVES MARKET VALUE FOR YOGURT, BY GEOGRAPHY, 2020-2026 (USD BILLION)
TABLE 13. GLOBAL DAIRY ALTERNATIVES MARKET VALUE FOR ICE CREAMS, BY GEOGRAPHY, 2020-2026 (USD BILLION)
TABLE 14. GLOBAL DAIRY ALTERNATIVES MARKET VALUE FOR MILK, BY GEOGRAPHY, 2020-2026 (USD BILLION)
TABLE 15. GLOBAL DAIRY ALTERNATIVES MARKET VALUE FOR OTHERS, BY GEOGRAPHY, 2020-2026 (USD BILLION)
TABLE 16. GLOBAL DAIRY ALTERNATIVES MARKET VALUE, BY FORMULATION, 2020-2026 (USD BILLION)
TABLE 17. GLOBAL DAIRY ALTERNATIVES MARKET VALUE FOR PLAIN, 2020-2026 (USD BILLION)
TABLE 18. GLOBAL DAIRY ALTERNATIVES MARKET VALUE FOR FLAVOURED, BY GEOGRAPHY, 2020-2026 (USD BILLION)
TABLE 19. NORTH AMERICA DAIRY ALTERNATIVES MARKET VALUE, BY COUNTRY, 2020-2026 (USD BILLION)
TABLE 20. NORTH AMERICA DAIRY ALTERNATIVES MARKET VALUE, BY SOURCE, 2020-2026 (USD BILLION)
TABLE 21. NORTH AMERICA DAIRY ALTERNATIVES MARKET VALUE, BY APPLICATION, 2020-2026 (USD BILLION)
TABLE 22. NORTH AMERICA DAIRY ALTERNATIVES MARKET VALUE, BY FORMULATION, 2020-2026 (USD BILLION)
TABLE 23. U.S DAIRY ALTERNATIVES MARKET VALUE, BY SOURCE, 2020-2026 (USD BILLION)
TABLE 24. U.S DAIRY ALTERNATIVES MARKET VALUE, BY APPLICATION, 2020-2026 (USD BILLION)
TABLE 25. U.S DAIRY ALTERNATIVES MARKET VALUE, BY FORMULATION, 2020-2026 (USD BILLION)
TABLE 26. CANADA DAIRY ALTERNATIVES MARKET VALUE, BY SOURCE, 2020-2026 (USD BILLION)
TABLE 27. CANADA DAIRY ALTERNATIVES MARKET VALUE, BY APPLICATION, 2020-2026 (USD BILLION)
TABLE 28. CANADA DAIRY ALTERNATIVES MARKET VALUE, BY FORMULATION, 2020-2026 (USD BILLION)
TABLE 29. EUROPE DAIRY ALTERNATIVES MARKET VALUE, BY COUNTRY, 2020-2026 (USD BILLION)
TABLE 30. EUROPE DAIRY ALTERNATIVES MARKET VALUE, BY SOURCE, 2020-2026 (USD BILLION)
TABLE 31. EUROPE DAIRY ALTERNATIVES MARKET VALUE, BY APPLICATION, 2020-2026 (USD BILLION)
TABLE 32. EUROPE DAIRY ALTERNATIVES MARKET VALUE, FORMULATION, 2020-2026 (USD BILLION)
TABLE 33. GERMANY DAIRY ALTERNATIVES MARKET VALUE, BY SOURCE, 2020-2026 (USD BILLION)
TABLE 34. GERMANY DAIRY ALTERNATIVES MARKET VALUE, BY APPLICATION, 2020-2026 (USD BILLION)
TABLE 35. GERMANY DAIRY ALTERNATIVES MARKET VALUE, BY FORMULATION, 2020-2026 (USD BILLION)
TABLE 36. U.K DAIRY ALTERNATIVES MARKET VALUE, BY SOURCE, 2020-2026 (USD BILLION)
TABLE 37. U.K DAIRY ALTERNATIVES MARKET VALUE, BY APPLICATION, 2020-2026 (USD BILLION)
TABLE 38. U.K DAIRY ALTERNATIVES MARKET VALUE, BY FORMULATION, 2020-2026 (USD BILLION)
TABLE 39. FRANCE DAIRY ALTERNATIVES MARKET VALUE, BY SOURCE, 2020-2026 (USD BILLION)
TABLE 40. FRANCE DAIRY ALTERNATIVES MARKET VALUE, BY APPLICATION, 2020-2026 (USD BILLION)
TABLE 41. FRANCE DAIRY ALTERNATIVES MARKET VALUE, BY FORMULATION, 2020-2026 (USD BILLION)
TABLE 42. ITALY DAIRY ALTERNATIVES MARKET VALUE, BY SOURCE, 2020-2026 (USD BILLION)
TABLE 43. ITALY DAIRY ALTERNATIVES MARKET VALUE, BY APPLICATION, 2020-2026 (USD BILLION)
TABLE 44. ITALY DAIRY ALTERNATIVES MARKET VALUE, BY FORMULATION, 2020-2026 (USD BILLION)
TABLE 45. SPAIN DAIRY ALTERNATIVES MARKET VALUE, BY SOURCE, 2020-2026 (USD BILLION)
TABLE 46. SPAIN DAIRY ALTERNATIVES MARKET VALUE, BY APPLICATION, 2020-2026 (USD BILLION)
TABLE 47. SPAIN DAIRY ALTERNATIVES MARKET VALUE, BY FORMULATION, 2020-2026 (USD BILLION)
TABLE 48. ROE DAIRY ALTERNATIVES MARKET VALUE, BY SOURCE, 2020-2026 (USD BILLION)
TABLE 49. ROE DAIRY ALTERNATIVES MARKET VALUE, BY APPLICATION, 2020-2026 (USD BILLION)
TABLE 50. ROE DAIRY ALTERNATIVES MARKET VALUE, BY FORMULATION, 2020-2026 (USD BILLION)
TABLE 51. ASIA PACIFIC DAIRY ALTERNATIVES MARKET VALUE, BY COUNTRY, 2020-2026 (USD BILLION)
TABLE 52. ASIA PACIFIC DAIRY ALTERNATIVES MARKET VALUE, BY SOURCE, 2020-2026 (USD BILLION)
TABLE 53. ASIA PACIFIC DAIRY ALTERNATIVES MARKET VALUE, BY APPLICATION, 2020-2026 (USD BILLION)
TABLE 54. ASIA PACIFIC DAIRY ALTERNATIVES MARKET VALUE, BY FORMULATION, 2020-2026 (USD BILLION)
TABLE 55. CHINA DAIRY ALTERNATIVES MARKET VALUE, BY SOURCE, 2020-2026 (USD BILLION)
TABLE 56. CHINA DAIRY ALTERNATIVES MARKET VALUE, BY APPLICATION, 2020-2026 (USD BILLION)
TABLE 57. CHINA DAIRY ALTERNATIVES MARKET VALUE, BY FORMULATION, 2020-2026 (USD BILLION)
TABLE 58. INDIA DAIRY ALTERNATIVES MARKET VALUE, BY SOURCE, 2020-2026 (USD BILLION)
TABLE 59. INDIA DAIRY ALTERNATIVES MARKET VALUE, BY APPLICATION, 2020-2026 (USD BILLION)
TABLE 60. INDIA DAIRY ALTERNATIVES MARKET VALUE, BY FORMULATION, 2020-2026 (USD BILLION)
TABLE 61. JAPAN DAIRY ALTERNATIVES MARKET VALUE, BY SOURCE, 2020-2026 (USD BILLION)
TABLE 62. JAPAN DAIRY ALTERNATIVES MARKET VALUE, BY APPLICATION, 2020-2026 (USD BILLION)
TABLE 63. JAPAN DAIRY ALTERNATIVES MARKET VALUE, BY FORMULATION, 2020-2026 (USD BILLION)
TABLE 64. REST OF APAC DAIRY ALTERNATIVES MARKET VALUE, BY SOURCE, 2020-2026 (USD BILLION)
TABLE 65. REST OF APAC DAIRY ALTERNATIVES MARKET VALUE, BY APPLICATION, 2020-2026 (USD BILLION)
TABLE 66. REST OF APAC DAIRY ALTERNATIVES MARKET VALUE, BY FORMULATION, 2020-2026 (USD BILLION)
TABLE 67. REST OF WORLD DAIRY ALTERNATIVES MARKET VALUE, BY SOURCE, 2020-2026 (USD BILLION)
TABLE 68. REST OF WORLD DAIRY ALTERNATIVES MARKET VALUE, BY APPLICATION, 2020-2026 (USD BILLION)
TABLE 69. REST OF WORLD DAIRY ALTERNATIVES MARKET VALUE, BY FORMULATION, 2020-2026 (USD BILLION)
TABLE 70. THE WHITE WAVE FOODS COMPANY: FINANCIAL
TABLE 71. THE WHITE WAVE FOODS COMPANY: PRODUCT & SERVICES
TABLE 72. THE WHITE WAVE FOODS COMPANY: RECENT DEVELOPMENT
TABLE 73. BLUE DIAMOND GROWERS: FINANCIAL
TABLE 74. BLUE DIAMOND GROWERS: PRODUCT & SERVICES
TABLE 75. BLUE DIAMOND GROWERS: RECENT DEVELOPMENT
TABLE 76. GREEN SPOT CO., LTD: FINANCIAL
TABLE 77. GREEN SPOT CO., LTD: PRODUCT & SERVICES
TABLE 78. GREEN SPOT CO., LTD: RECENT DEVELOPMENT
TABLE 79. FREEDOM FOODS GROUP LIMITED: FINANCIAL
TABLE 80. FREEDOM FOODS GROUP LIMITED: PRODUCT & SERVICES
TABLE 81. FREEDOM FOODS GROUP LIMITED: RECENT DEVELOPMENT
TABLE 82. EARTH’S OWN FOOD COMPANY INC: FINANCIAL
TABLE 83. EARTH’S OWN FOOD COMPANY INC: PRODUCT & SERVICES
TABLE 84. EARTH’S OWN FOOD COMPANY INC: RECENT DEVELOPMENT
TABLE 85. HAIN CELESTIAL: FINANCIAL
TABLE 86. HAIN CELESTIAL: PRODUCT & SERVICES
TABLE 87. HAIN CELESTIAL: RECENT DEVELOPMENT
TABLE 88. SUNOPTA: FINANCIAL
TABLE 89. SUNOPTA: PRODUCT & SERVICES
TABLE 90. SUNOPTA: RECENT DEVELOPMENT
TABLE 91. ECOMIL: FINANCIAL
TABLE 92. ECOMIL: PRODUCT & SERVICES
TABLE 93. ECOMIL: RECENT DEVELOPMENT
TABLE 94. SANITARIUM: FINANCIAL
TABLE 95. SANITARIUM: PRODUCT & SERVICES
TABLE 96. SANITARIUM: RECENT DEVELOPMENT
TABLE 97. EDEN FOODS INC: FINANCIAL
TABLE 98. EDEN FOODS INC: PRODUCT & SERVICES
TABLE 99. EDEN FOODS INC: RECENT DEVELOPMENT
TABLE 100. TRIBALLAT NOYAL: PRODUCTS & SERVICES
TABLE 101. VALSOIA SPA: PRODUCTS & SERVICES
TABLE 102. DOHLER: PRODUCTS & SERVICES
TABLE 103. PANOS BRANDS: PRODUCTS & SERVICES
TABLE 104. HILAND DAIRY: PRODUCTS & SERVICES
TABLE 105. RIPPLE FOODS: PRODUCTS & SERVICES
TABLE 106. CALIFIA FARMS: PRODUCTS & SERVICES
Research Framework
Infoholic Research works on a holistic 360° approach in order to deliver high quality, validated and reliable information in our market reports. The Market estimation and forecasting involves following steps:
- Data Collation (Primary & Secondary)
- In-house Estimation (Based on proprietary data bases and Models)
- Market Triangulation
- Forecasting

Market related information is congregated from both primary and secondary sources.
Primary sources
Involved participants from all global stakeholders such as Solution providers, service providers, Industry associations, thought leaders etc. across levels such as CXOs, VPs and managers. Plus, our in-house industry experts having decades of industry experience contribute their consulting and advisory services.
Secondary sources
Include public sources such as regulatory frameworks, government IT spending, government demographic indicators, industry association statistics, and company publications along with paid sources such as Factiva, OneSource, Bloomberg among others.
![]()


