
Crude Oil Desalter Market based on Type (Single Stage, Two Stage and Three Stage), End-Use (FCC Feed Desalting, Heavy Crude Desalting, Distillate Treating and Other), Application (Upstream, Downstream and Other Application), and Geography – Global Forecast up to 2026
- March, 2021
- Domain: Chemicals, Materials & Food - Specialty Chemicals
- Get Free 10% Customization in this Report
Crude oil is extracted from offshore, consisting of various harmful contaminants such as polymer, mud, water, salts, and sand. To eliminate salts and dampness from crude oil, crude oil desalters are used. As to remove water present in the crude oil, the method is used known as crude oil electrostatic dehydrator. If crude oil is not filtered, then the contaminants, water, and salt in the crude oil will cause various maintenance and operating issues such as abrasion, corrosion, and poisoning of catalysts in the processing division. Growing demand for crude oil will push for aging wells, which will increase the demand for salt and water content among upstream and downstream sectors. This, in turn, is expected to enhance the crude oil desalter market share. The most usual salts that come in crude oil while refining are sodium chloride, calcium chloride, and magnesium chlorides. These salts present in the crude oil can cause corrosion in the refinery equipment. The uncertain price of crude oil is likely to hinder the growth of the crude oil desalter market. The Crude Oil Desalter Market is expected to grow at the rate of 8.8% CAGR by 2026.
Research Methodology:
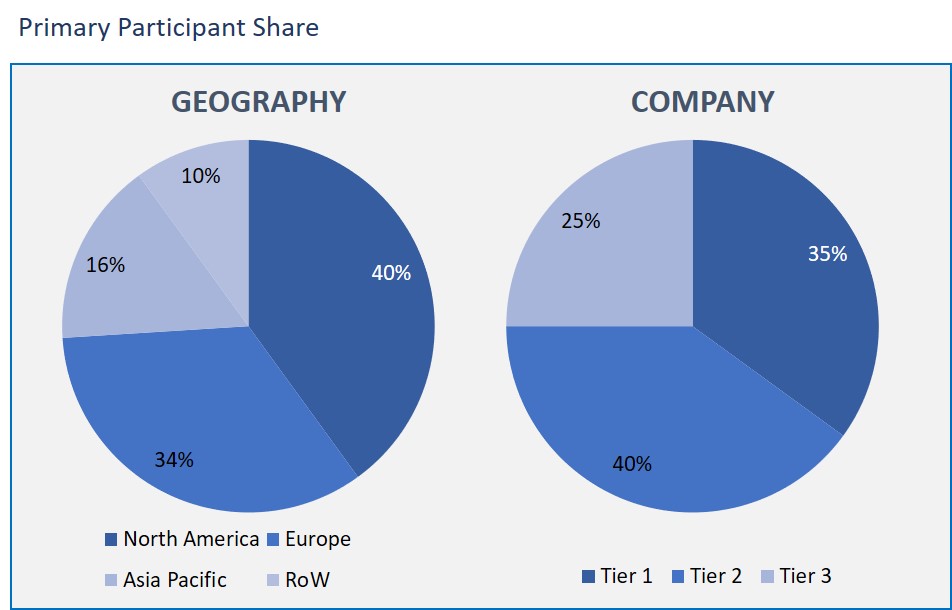
The crude oil desalter market has been analyzed by utilizing the optimum combination of secondary sources and in-house methodology, along with an irreplaceable blend of primary insights. The real-time assessment of the market is an integral part of our market sizing and forecasting methodology. Our industry experts and panel of primary participants have helped in compiling relevant aspects with realistic parametric estimations for a comprehensive study. The participation share of different categories of primary participants is given below:
Crude Oil Desalter Market based on Type:
- Single Stage
- Two-Stage
- Three Stage
Crude Oil Market based on End-Use:
- FCC Feed Desalting
- Heavy Crude Desalting
- Distillate Treating
- Other
Crude Oil Market based on Application Area:
- Upstream
- Downstream
- Other Application Areas
Crude Oil Market based on Geography
- North America
- Europe
- Asia Pacific
- Rest of the World
In segmentation based on type, the market is divided into ‘single stage’, ‘two stage’, and ‘three stage’ segments. Among them, ‘two stage’ desalter is having significant growth in the crude oil desalter market. The highest growth of the two stage desalter segment is ascribed to the provision of high efficiency of two stage desalter along with rising usage of the heavy petroleum in refineries around the world.
In terms of end-use, the market is categorized into FCC feed desalting, heavy crude desalting, distillate treating, and others. Amidst these, the heavy crude oil desalting has a major role in the market growth has a major share. This is due to the increasing demand for heavy crude oils arising because of the dearth of light oils. With such an ongoing trend, refineries are mostly using heavy crude oil.
As per the application, the market is bifurcated into upstream, downstream, and others. The upstream segment is having the highest share in the market because the upstream segment covers the transition of crude oil, requiring it to use necessary chemicals, including crude oil desalters. Moreover, the upstream adoption of upstream is considered more profitable compared to downstream operations. Therefore, the demand for crude oil desalters has high demand in the upstream sector.
As observed in the geographical segment, the Asia Pacific region registered the highest growth rate in the crude oil desalter market. The highest growth rate is attributed to the China-driven rising investments in the expansion of the refineries, increasing demand for petroleum owing to the rising population, and expanding investigation & production in few countries, encouraging the market growth.
The global crude oil desalter plays a crucial role for the oil & gas sector. The rising number of refineries in the near term is anticipated to obtain traction over the forecast period. There are other various drivers which can uplift the crude oil desalter market upwards in the forecasted years. Some of them being the emergence of petroleum refineries in many regions and increasing classic production companies is projected to boost the global crude oil desalter market growth.
Some of the key players of the crude oil desalter market include Croda International Plc, Agar Corporation Ltd., Cameron International Corporation, Canadian Petroleum Processing Equipment Inc., ICE (Asia) Pvt Ltd, VME Process Inc., Komax systems Inc., Petro-Techna International, En-Fab, Inc., GasTech Engineering Corp, PROSERNAT S.A and Frames Group.
Since crude oil is a very important source of fuel, the heavier sources of it have enhanced the demand for crude oil desalters around the world. In addition to that, the majority of the world is dependent on fuel and gas in the use of a number of applications such as transportation, paving roads, generating electricity, and others.
- This report defines, describes, the outline of market growth impacting factors, and forecast for the target market
- This report provides the analysis and consequences for the global crude oil desalter market by segment and region followed by countries
- This report depicts the key market player profiles, their latest developments, strategies, key competencies, presence by region, and product portfolio
- This report further provides valuable insights, data, and forecasts, which are useful in planning business strategies, tapping market opportunities, understand business associated risks, obtain business goals, recognizing trends, and understand target end-users.
- Executive Summary
- Industry Outlook
- Industry Overview
- Industry Trends
- Market Snapshot
- Market Definition
- Market Outlook
- Porter Five Forces
- Related Markets
- Market characteristics
- Market Overview
- Market Segmentation
- Market Dynamics
- Drivers
- Restraints
- Opportunities
- DRO - Impact Analysis
- Type: Market Size & Analysis
- Overview
- Single Stage
- Two Stage
- Three Stage
- AC Field Electrostatic Dehydrator
- Combined AC-DC Field Electrostatic Dehydrator
- DC Field Electrostatic Dehydrator
- END-USE: Market Size & Analysis
- Overview
- FCC Feed Desalting
- Heavy Crude Desalting
- Distillate Treating
- Other
- Application Area: Market Size & Analysis
- Overview
- Upstream
- Downstream
- Other Application Area
- Geography: Market Size & Analysis
- Overview
- North America
- Europe
- Asia Pacific
- Rest of the World
- Competitive Landscape
- Competitor Comparison Analysis
- Market Developments
- Mergers and Acquisitions, Legal, Awards, Partnerships
- Product Launches and execution
- Vendor Profiles
- SUEZ Environment Oil & Gas Systems
- Overview
- Financial Overview
- Product Offerings
- Developments
- Business Strategy
- Petro-Techna International, ICE (Asia) Pvt. Ltd
- Overview
- Financial Overview
- Product Offerings
- Developments
- Business Strategy
- Canadian Petroleum Processing Equipment Inc.
- Overview
- Financial Overview
- Product Offerings
- Developments
- Business Strategy
- Schlumberger
- Overview
- Financial Overview
- Product Offerings
- Developments
- Business Strategy
- Croda International Plc
- Overview
- Financial Overview
- Product Offerings
- Developments
- Business Strategy
- Petro Techna
- Overview
- Financial Overview
- Product Offerings
- Developments
- Business Strategy
- Fjords Processing
- Overview
- Financial Overview
- Product Offerings
- Developments
- Business Strategy
- Mackenzie Hydrocarbons
- Overview
- Financial Overview
- Product Offerings
- Developments
- Business Strategy
- ETI Process Group
- Overview
- Financial Overview
- Product Offerings
- Developments
- Business Strategy
- Forum Energy Technologies
- Overview
- Financial Overview
- Product Offerings
- Developments
- Business Strategy
- SUEZ Environment Oil & Gas Systems
- Companies to Watch
- Annexure
- Report Scope
- Market Definitions
- Research Methodology
- Data Collation and In-house Estimation
- Market Triangulation
- Forecasting
- Report Assumptions
- Declarations
- Stakeholders
- Abbreviations
TABLE 1. GLOBAL CRUDE OIL DESALTER MARKET VALUE, BY TYPE, 2020-2026 (USD BILLION)
TABLE 2. GLOBAL CRUDE OIL DESALTER MARKET VALUE FOR SINGLE STAGE, BY GEOGRAPHY, 2020-2026 (USD BILLION)
TABLE 3. GLOBAL CRUDE OIL DESALTER MARKET VALUE FOR TWO STAGE, BY GEOGRAPHY, 2020-2026 (USD BILLION)
TABLE 4. GLOBAL CRUDE OIL DESALTER MARKET VALUE FOR THREE STAGE, BY GEOGRAPHY, 2020-2026 (USD BILLION)
TABLE 5. GLOBAL CRUDE OIL DESALTER MARKET VALUE FOR AC FIELD ELECTROSTATIC DEHYDRATOR, BY GEOGRAPHY, 2020-2026 (USD BILLION)
TABLE 6. GLOBAL CRUDE OIL DESALTER MARKET VALUE FOR COMBINED AC-DC FIELD ELECTROSTATIC DEHYDRATOR, BY GEOGRAPHY, 2020-2026 (USD BILLION)
TABLE 7. GLOBAL CRUDE OIL DESALTER MARKET VALUE FOR DC FIELD ELECTROSTATIC DEHYDRATOR, BY GEOGRAPHY, 2020-2026 (USD BILLION)
TABLE 8. GLOBAL CRUDE OIL DESALTER MARKET VALUE, BY END-USE, 2020-2026 (USD BILLION)
TABLE 9. GLOBAL CRUDE OIL DESALTER MARKET VALUE FOR FCC FEED DESALTING, BY GEOGRAPHY, 2020-2026 (USD BILLION)
TABLE 10. GLOBAL CRUDE OIL DESALTER MARKET VALUE FOR HEAVY CRUDE DESALTING, BY GEOGRAPHY, 2020-2026 (USD BILLION)
TABLE 11. GLOBAL CRUDE OIL DESALTER MARKET VALUE FOR DISTILLATE TREATING, BY GEOGRAPHY, 2020-2026 (USD BILLION)
TABLE 12. GLOBAL CRUDE OIL DESALTER MARKET VALUE FOR OTHER, BY GEOGRAPHY, 2020-2026 (USD BILLION)
TABLE 13. GLOBAL CRUDE OIL DESALTER MARKET VALUE, BY APPLICATION AREA, 2020-2026 (USD BILLION)
TABLE 14. GLOBAL CRUDE OIL DESALTER MARKET VALUE FOR UPSTREAM, BY GEOGRAPHY, 2020-2026 (USD BILLION)
TABLE 15. GLOBAL CRUDE OIL DESALTER MARKET VALUE FOR DOWNSTREAM, BY GEOGRAPHY, 2020-2026 (USD BILLION)
TABLE 16. GLOBAL CRUDE OIL DESALTER MARKET VALUE FOR OTHER APPLICATION AREA, BY GEOGRAPHY, 2020-2026 (USD BILLION)
TABLE 17. GLOBAL CRUDE OIL DESALTER MARKET VALUE FOR OTHER END-USER, BY GEOGRAPHY, 2020-2026 (USD BILLION)
TABLE 18. NORTH AMERICA CRUDE OIL DESALTER MARKET VALUE, BY COUNTRY, 2020-2026 (USD BILLION)
TABLE 19. NORTH AMERICA CRUDE OIL DESALTER MARKET VALUE, BY TYPE, 2020-2026 (USD BILLION)
TABLE 20. NORTH AMERICA CRUDE OIL DESALTER MARKET VALUE, BY END-USE, 2020-2026 (USD BILLION)
TABLE 21. NORTH AMERICA CRUDE OIL DESALTER MARKET VALUE, BY APPLICATION AREA, 2020-2026 (USD BILLION)
TABLE 22. U.S CRUDE OIL DESALTER MARKET VALUE, BY TYPE, 2020-2026 (USD BILLION)
TABLE 23. U.S CRUDE OIL DESALTER MARKET VALUE, BY END-USE, 2020-2026 (USD BILLION)
TABLE 24. U.S CRUDE OIL DESALTER MARKET VALUE, BY APPLICATION AREA, 2020-2026 (USD BILLION)
TABLE 25. CANADA CRUDE OIL DESALTER MARKET VALUE, BY TYPE, 2020-2026 (USD BILLION)
TABLE 26. CANADA CRUDE OIL DESALTER MARKET VALUE, BY END-USE, 2020-2026 (USD BILLION)
TABLE 27. CANADA CRUDE OIL DESALTER MARKET VALUE, BY APPLICATION AREA, 2020-2026 (USD BILLION)
TABLE 28. EUROPE CRUDE OIL DESALTER MARKET VALUE, BY COUNTRY, 2020-2026 (USD BILLION)
TABLE 29. EUROPE CRUDE OIL DESALTER MARKET VALUE, BY TYPE, 2020-2026 (USD BILLION)
TABLE 30. EUROPE CRUDE OIL DESALTER MARKET VALUE, BY END-USE, 2020-2026 (USD BILLION)
TABLE 31. EUROPE CRUDE OIL DESALTER MARKET VALUE, APPLICATION AREA, 2020-2026 (USD BILLION)
TABLE 32. GERMANY CRUDE OIL DESALTER MARKET VALUE, BY TYPE, 2020-2026 (USD BILLION)
TABLE 33. GERMANY CRUDE OIL DESALTER MARKET VALUE, BY END-USE, 2020-2026 (USD BILLION)
TABLE 34. GERMANY CRUDE OIL DESALTER MARKET VALUE, BY APPLICATION AREA, 2020-2026 (USD BILLION)
TABLE 35. U.K CRUDE OIL DESALTER MARKET VALUE, BY TYPE, 2020-2026 (USD BILLION)
TABLE 36. U.K CRUDE OIL DESALTER MARKET VALUE, BY END-USE, 2020-2026 (USD BILLION)
TABLE 37. U.K CRUDE OIL DESALTER MARKET VALUE, BY APPLICATION AREA, 2020-2026 (USD BILLION)
TABLE 38. FRANCE CRUDE OIL DESALTER MARKET VALUE, BY TYPE, 2020-2026 (USD BILLION)
TABLE 39. FRANCE CRUDE OIL DESALTER MARKET VALUE, BY END-USE, 2020-2026 (USD BILLION)
TABLE 40. FRANCE CRUDE OIL DESALTER MARKET VALUE, BY APPLICATION AREA, 2020-2026 (USD BILLION)
TABLE 41. ITALY CRUDE OIL DESALTER MARKET VALUE, BY TYPE, 2020-2026 (USD BILLION)
TABLE 42. ITALY CRUDE OIL DESALTER MARKET VALUE, BY END-USE, 2020-2026 (USD BILLION)
TABLE 43. ITALY CRUDE OIL DESALTER MARKET VALUE, BY APPLICATION AREA, 2020-2026 (USD BILLION)
TABLE 44. SPAIN CRUDE OIL DESALTER MARKET VALUE, BY TYPE, 2020-2026 (USD BILLION)
TABLE 45. SPAIN CRUDE OIL DESALTER MARKET VALUE, BY END-USE, 2020-2026 (USD BILLION)
TABLE 46. SPAIN CRUDE OIL DESALTER MARKET VALUE, BY APPLICATION AREA, 2020-2026 (USD BILLION)
TABLE 47. ROE CRUDE OIL DESALTER MARKET VALUE, BY TYPE, 2020-2026 (USD BILLION)
TABLE 48. ROE CRUDE OIL DESALTER MARKET VALUE, BY END-USE, 2020-2026 (USD BILLION)
TABLE 49. ROE CRUDE OIL DESALTER MARKET VALUE, BY APPLICATION AREA, 2020-2026 (USD BILLION)
TABLE 50. ASIA PACIFC CRUDE OIL DESALTER MARKET VALUE, BY COUNTRY, 2020-2026 (USD BILLION)
TABLE 51. ASIA PACIFC CRUDE OIL DESALTER MARKET VALUE, BY TYPE, 2020-2026 (USD BILLION)
TABLE 52. ASIA PACIFC CRUDE OIL DESALTER MARKET VALUE, BY END-USE, 2020-2026 (USD BILLION)
TABLE 53. ASIA PACIFC CRUDE OIL DESALTER MARKET VALUE, BY APPLICATION AREA, 2020-2026 (USD BILLION)
TABLE 54. CHINA CRUDE OIL DESALTER MARKET VALUE, BY TYPE, 2020-2026 (USD BILLION)
TABLE 55. CHINA CRUDE OIL DESALTER MARKET VALUE, BY END-USE, 2020-2026 (USD BILLION)
TABLE 56. CHINA CRUDE OIL DESALTER MARKET VALUE, BY APPLICATION AREA, 2020-2026 (USD BILLION)
TABLE 57. INDIA CRUDE OIL DESALTER MARKET VALUE, BY TYPE, 2020-2026 (USD BILLION)
TABLE 58. INDIA CRUDE OIL DESALTER MARKET VALUE, BY END-USE, 2020-2026 (USD BILLION)
TABLE 59. INDIA CRUDE OIL DESALTER MARKET VALUE, BY APPLICATION AREA, 2020-2026 (USD BILLION)
TABLE 60. JAPAN CRUDE OIL DESALTER MARKET VALUE, BY TYPE, 2020-2026 (USD BILLION)
TABLE 61. JAPAN CRUDE OIL DESALTER MARKET VALUE, BY END-USE, 2020-2026 (USD BILLION)
TABLE 62. JAPAN CRUDE OIL DESALTER MARKET VALUE, BY APPLICATION AREA, 2020-2026 (USD BILLION)
TABLE 63. REST OF APAC CRUDE OIL DESALTER MARKET VALUE, BY TYPE, 2020-2026 (USD BILLION)
TABLE 64. REST OF APAC CRUDE OIL DESALTER MARKET VALUE, BY END-USE, 2020-2026 (USD BILLION)
TABLE 65. REST OF APAC CRUDE OIL DESALTER MARKET VALUE, BY APPLICATION AREA, 2020-2026 (USD BILLION)
TABLE 66. REST OF WORLD CRUDE OIL DESALTER MARKET VALUE, BY TYPE, 2020-2026 (USD BILLION)
TABLE 67. REST OF WORLD CRUDE OIL DESALTER MARKET VALUE, BY END-USE, 2020-2026 (USD BILLION)
TABLE 68. REST OF WORLD CRUDE OIL DESALTER MARKET VALUE, BY APPLICATION AREA, 2020-2026 (USD BILLION)
TABLE 69. SUEZ ENVIRONMENT OIL & GAS SYSTEMS: FINANCIALS
TABLE 70. SUEZ ENVIRONMENT OIL & GAS SYSTEMS: PRODUCT AND SERVICES
TABLE 71. SUEZ ENVIRONMENT OIL & GAS SYSTEMS: RECENT DEVELOPMENTS
TABLE 72. SUEZ ENVIRONMENT OIL & GAS SYSTEMS: APPLICATION AREA/SERVICE PROVIDER PORTFOLIO
TABLE 73. PETRO-TECHNA INTERNATIONAL, ICE (ASIA) PVT. LTD: FINANCIALS
TABLE 74. PETRO-TECHNA INTERNATIONAL, ICE (ASIA) PVT. LTD: PRODUCT AND SERVICES
TABLE 75. PETRO-TECHNA INTERNATIONAL, ICE (ASIA) PVT. LTD: RECENT DEVELOPMENTS
TABLE 76. PETRO-TECHNA INTERNATIONAL, ICE (ASIA) PVT. LTD: APPLICATION AREA/SERVICE PROVIDER PORTFOLIO
TABLE 77. CANADIAN PETROLEUM PROCESSING EQUIPMENT INC: FINANCIALS
TABLE 78. CANADIAN PETROLEUM PROCESSING EQUIPMENT INC: PRODUCT AND SERVICES
TABLE 79. CANADIAN PETROLEUM PROCESSING EQUIPMENT INC: RECENT DEVELOPMENTS
TABLE 80. CANADIAN PETROLEUM PROCESSING EQUIPMENT INC: APPLICATION AREA/SERVICE PROVIDER PORTFOLIO
TABLE 81. SCHLUMBERGER: FINANCIALS
TABLE 82. SCHLUMBERGER: PRODUCT AND SERVICES
TABLE 83. SCHLUMBERGER: RECENT DEVELOPMENTS
TABLE 84. SCHLUMBERGER: APPLICATION AREA/SERVICE PROVIDER PORTFOLIO
TABLE 85. CRODA INTERNATIONAL PLC: FINANCIALS
TABLE 86. CRODA INTERNATIONAL PLC: PRODUCT AND SERVICES
TABLE 87. CRODA INTERNATIONAL PLC: RECENT DEVELOPMENTS
TABLE 88. CRODA INTERNATIONAL PLC: APPLICATION AREA/SERVICE PROVIDER PORTFOLIO
TABLE 89. PETRO TECHNA: FINANCIALS
TABLE 90. PETRO TECHNA: PRODUCT AND SERVICES
TABLE 91. PETRO TECHNA: RECENT DEVELOPMENTS
TABLE 92. PETRO TECHNA: APPLICATION AREA/SERVICE PROVIDER PORTFOLIO
TABLE 93. FJORDS PROCESSING: FINANCIALS
TABLE 94. FJORDS PROCESSING: PRODUCT AND SERVICES
TABLE 95. FJORDS PROCESSING: RECENT DEVELOPMENTS
TABLE 96. FJORDS PROCESSING: APPLICATION AREA/SERVICE PROVIDER PORTFOLIO
TABLE 97. MACKENZIE HYDROCARBONS: FINANCIALS
TABLE 98. MACKENZIE HYDROCARBONS: PRODUCT AND SERVICES
TABLE 99. MACKENZIE HYDROCARBONS: RECENT DEVELOPMENTS
TABLE 100. MACKENZIE HYDROCARBONS: APPLICATION AREA/SERVICE PROVIDER PORTFOLIO
TABLE 101. ETI PROCESS GROUP: FINANCIALS
TABLE 102. ETI PROCESS GROUP: PRODUCT AND SERVICES
TABLE 103. ETI PROCESS GROUP: RECENT DEVELOPMENTS
TABLE 104. ETI PROCESS GROUP: APPLICATION AREA/SERVICE PROVIDER PORTFOLIO
TABLE 105. FORUM ENERGY TECHNOLOGIES: FINANCIALS
TABLE 106. FORUM ENERGY TECHNOLOGIES: PRODUCT AND SERVICES
TABLE 107. FORUM ENERGY TECHNOLOGIES: RECENT DEVELOPMENTS
TABLE 108. FORUM ENERGY TECHNOLOGIES: APPLICATION AREA/SERVICE PROVIDER PORTFOLIO
TABLE 109. ALFA LAVAL: PRODUCT AND SERVICES
Research Framework
Infoholic Research works on a holistic 360° approach in order to deliver high quality, validated and reliable information in our market reports. The Market estimation and forecasting involves following steps:
- Data Collation (Primary & Secondary)
- In-house Estimation (Based on proprietary data bases and Models)
- Market Triangulation
- Forecasting

Market related information is congregated from both primary and secondary sources.
Primary sources
Involved participants from all global stakeholders such as Solution providers, service providers, Industry associations, thought leaders etc. across levels such as CXOs, VPs and managers. Plus, our in-house industry experts having decades of industry experience contribute their consulting and advisory services.
Secondary sources
Include public sources such as regulatory frameworks, government IT spending, government demographic indicators, industry association statistics, and company publications along with paid sources such as Factiva, OneSource, Bloomberg among others.
![]()


