
Conductive Grease Market By Type (Thermal and Electric), By End-User (Electrical & Electronics, Telecommunication, Transportation and other) and By Geography – Global Driver, Restraints, Opportunities, Trends, and Forecast to 2022
- October, 2017
- Domain: Chemicals, Materials & Food - Industrial Chemicals
- Get Free 10% Customization in this Report
Conductive grease is a material that is applied between the surfaces to reduce the friction without loss or restrictions of energy transfer. It helps the flow of electrical or thermal energy, and provides cost benefits to the overall mechanism. The material is majorly used by electrical & electronic industry, where it helps to manage complete heat and electrical management solutions. Thermal conductive grease and electrical conductive grease are the two key types of conductive grease, where thermal conductivity has the advantage of being utilized more which is increasing its market value. Conductive grease is a part of the energy saving materials, owing to its ability to facilitate heat transfer with minimum or no loss.
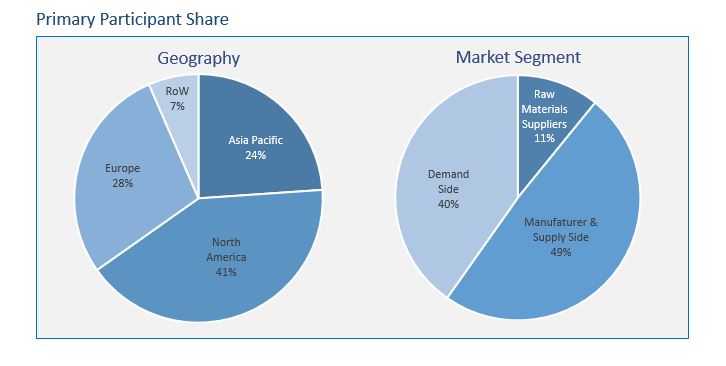
Research Methodology
The conductive grease market has been analyzed by utilizing the optimum combination of secondary sources and in-house methodology along with an irreplaceable blend of primary insights. The real-time assessment of the market is an integral part of our market sizing and forecasting methodology, wherein our industry experts and panel of primary participants helped in compiling the best quality with realistic parametric estimations. Further, the participation share of different categories of primary participants is given below:
Key Market Insights
Currently, with the advantages of having a bigger market for electrical & electronics, such as China, Philippines etc., Asia Pacific is the global leader in the conductive grease market. Big manufacturing units are having most of the consumption and increasing Asia Pacific’s lead in the global market. North America is another prominent market for conductive grease having the advantage of being the leader in various electronic solutions and healthcare devices. Europe followed North America to be termed as the third largest market for conductive grease, as it is the leader in the transportation industry. Rapidly changing consumer demands and high consumer spending in North America and Europe are expected to boost the market of conductive grease. Two developed regions of North America and Europe collectively account for around half of the global market, however, the share is expected to decline due to the high growth in developing countries. Middle East & African countries show a high growth rate during the forecast period due to the increasing industrialization. Globally, the demand for conductive grease is growing consistently, especially in Asia Pacific and North America.
Thermal conductive grease is highly dominating the market at both the global and regional level, owing to the high adoption rate and easy installation. Other than thermal, the other form of conductive grease is electrical conductive grease which is also increasing its market during the forecast period with a high adoption coming from the technological and product level innovations.
The study of the global conductive grease market provides market size information and market trends along with the factors and parameters impacting the market in both short- and long-term. The study ensures a 360° view, bringing out the complete key insights of the industry. These insights help the business decision-makers to make better business plans and informed decisions for future business. In addition, the study helps venture capitalists in understanding the companies better and take informed decisions.
According to Infoholic Research, the global conductive grease market is expected to grow at a CAGR of 9.5% during the forecast period to reach $809.0 million by 2022. The thermal conductive grease is expected to maintain global dominance, which is driven by China and India. Asia Pacific is expected to contribute the highest toward the global conductive grease market. Some of the key players in conductive grease is Dow Corning, Honeywell Corporation, Momentive Performance Materials, Wacker Chemie AG, and Parker Hannifin.
Report Scope:
- Type
- Thermal Conductive Grease
- Electrical Conductive Grease
- End-user
- Electrical & Electronics
- Telecommunications
- Transportation
- Others
- Regions
- Asia Pacific
- North America
- Europe
- Rest of the World
- Industry outlook: Market trends, drivers, restraints, and opportunities
1 Report Outline
1.1 Introduction
1.2 Report Scope
1.3 Market Definition
1.4 Research Methodology
1.4.1 Data Collation & In-house Estimation
1.4.2 Market Triangulation
1.4.3 Forecasting
1.5 Study Declaration
1.6 Report Assumptions
1.7 Stakeholders
2 Executive Summary
2.1 Large domestic demand and homegrown supply capabilities helping China to strengthen its market share
2.2 Growing Lightening and advance electronic solution demand boosting the consumption of conductive grease in Asia Pacific
3 Market Positioning
3.1 Total Addressable Market (TAM): Conductive Interface Materials
3.1.1 Market Overview
3.1.2 Major Trends
3.2 Segmented Addressable Market
3.3 Related Markets
4 Market Outlook
4.1 Overview
4.2 Value Chain Analysis
4.3 PESTLE
4.4 Porter 5 (Five) Forces
4.5 Patent Analysis
5 Market Characteristics
5.1 Market Segmentation
5.2 Market Dynamics
5.2.1 Drivers
5.2.1.1 Increasing requirement for the advanced heat sensitive components
5.2.1.2 Resurgence in manufacturing and industrial activity
5.2.2 Restraints
5.2.2.1 Disruptions in the manufacturing market environment
5.2.2.2 Increasing and broad market of the alternative products
5.2.3 Opportunities
5.2.3.1 Increasing electrification in the end-user industries.
5.2.3.2 Large untapped market in developing and underdeveloped countries
5.2.4 DRO – Impact Analysis
6 Type: Market Size & Analysis
6.1 Overview
6.2 Thermal Conductive
6.3 Electrical Conductive
6.4 Vendor Profiles
6.4.1 Dow Corning
6.4.2 Momentive Performance Materials Inc.
6.4.3 Wacker Chemie AG
6.4.4 Electrolube
6.4.5 Honeywell International Inc.
6.4.6 Parker Hannifin Corporation.
(Overview, business unit, geographic revenue, product profile, recent developments, business focus, SWOT analysis and business strategy are covered for all the vendors)
7 End-users: Market Size & Analysis
7.1 Overview
7.2 Electrical & Electronics
7.3 Telecommunication
7.4 Transportations
7.5 Customers Profile
7.5.1 Toyota Motor Corporation
7.5.2 3M
7.5.3 General Electric (GE)
7.5.4 ECI Telecom Ltd.
(Overview, business unit, geographic revenue, business segments, SWOT analysis and Business strategy are covered for all the customers)
8 Regions: Market Size and Analysis
8.1 Overview
8.2 Asia Pacific
8.2.1 Asia Pacific Market, By Countries
8.2.2 Asia Pacific Market, By types
8.2.3 Asia Pacific Market, By end-users
8.3 Europe
8.3.1 Europe Market, By Countries
8.3.2 Europe Market, By types
8.3.3 Europe Market, By End-users
8.4 North America
8.4.1 North America Market, By Countries
8.4.2 North America Market, By types
8.4.3 North America Market, By End-users
8.5 Rest of the World
8.5.1 Rest of the World, By Regions
8.5.2 Rest OF the World Market, By Types
8.5.3 Rest of the World Market, By End-users
9 Companies to Watch for
9.1 Dow Corning, is Creating a Powerful Ally for Conductive Management Solutions
9.2 Innovative Phase Change Materials from Electrolube that provides Alternatives solution for Thermal conductive grease
10 Competitive Landscape
10.1 Competitor Comparison Analysis
10.2 Market Landscape
10.2.1 Mergers, Acquisitions & Joint Ventures
10.2.2 Expansion
10.2.3 Exhibition & Product Launch
10.2.4 Divestment & Divestiture
10.2.5 Restructure & Repositioning
10.2.6 Legal & Price Hikes
11 Expert’s Views
Annexure
Acronyms
TABLE 1 GLOBAL CONDUCTIVE GREASE MARKET VALUE BY TYPES 2015−2022 ($MILLION) 30
TABLE 2 GLOBAL CONDUCTIVE GREASE MARKET VOLUME BY TYPES, 2015−2022 (KILOTONS) 31
TABLE 3 GLOBAL THERMAL CONDUCTIVE GREASE MARKET VALUE, BY GEOGRAPHY, 2015−2022 ($MILLION) 32
TABLE 4 GLOBAL THERMAL CONDUCTIVE GREASE MARKET VOLUME, 2015−2022 (KILOTONS) 32
TABLE 5 GLOBAL ELECTRICAL CONDUCTIVE GREASE MARKET VALUE, BY GEOGRAPHY, 2015−2022 ($MILLION) 33
TABLE 6 GLOBAL ELECTRICAL CONDUCTIVE GREASE MARKET VOLUME, 2015−2022 (KILOTONS) 34
TABLE 7 DOW CORNING: PRODUCT PROFILE 36
TABLE 8 DOW CORNING: RECENT DEVELOPMENTS 36
TABLE 9 MOMENTIVE PERFORMANCE MATERIALS INC.: RECENT DEVELOPMENTS 41
TABLE 10 WACKER CHEMIE AG: BUSINESS SEGMENTS 46
TABLE 11 WACKER CHEMIE AG: RECENT DEVELOPMENTS 46
TABLE 12 ELECTROLUBE: PRODUCT PROFILE 51
TABLE 13 ELECTROLUBE: RECENT DEVELOPMENTS 51
TABLE 14 HONEYWELL INTERNATIONAL INC: BUSINESS SEGMENTS 56
TABLE 15 HONEYWELL INTERNATIONAL INC: RECENT DEVELOPMENTS 57
TABLE 16 PARKER HANNIFIN CORPORATION: RECENT DEVELOPMENTS 62
TABLE 17 GLOBAL CONDUCTIVE GREASE MARKET VALUE, BY END-USERS, 2015-2022($MILLION) 65
TABLE 18 GLOBAL CONDUCTIVE GREASE MARKET VOLUME, BY END-USERS, 2015-2022 (KILOTONS) 66
TABLE 19 GLOBAL CONDUCTIVE GREASE MARKET VALUE, IN ELECTRICAL & ELECTRONICS BY GEOGRAPHY, 2015-2022 ($MILLION) 67
TABLE 20 GLOBAL CONDUCTIVE GREASE MARKET VOLUME, IN ELECTRICAL & ELECTRONICS, BY GEOGRAPHY, 2015-2022 (KILOTONS) 68
TABLE 21 GLOBAL CONDUCTIVE GREASE MARKET VALUE, IN TELECOMMUNICATIONS, BY GEOGRAPHY, 2015-2022 ($MILLION) 69
TABLE 22 GLOBAL CONDUCTIVE GREASE MARKET VOLUME, IN TELECOMMUNICATIONS, BY GEOGRAPHY, 2015-2022 (KILOTONS) 69
TABLE 23 GLOBAL CONDUCTIVE GREASE MARKET REVENUE, IN TRANSPORTATION, BY GEOGRAPHY, 2015-2022 ($MILLION) 70
TABLE 24 GLOBAL CONDUCTIVE GREASE MARKET VOLUME, IN TRANSPORTATIONS, BY GEOGRAPHY, 2015-2022 (KILOTONS) 71
TABLE 25 GLOBAL CONDUCTIVE GREASE MARKET VALUE BY GEOGRAPHY, 2015−2022 ($MILLION) 88
TABLE 26 GLOBAL CONDUCTIVE GREASE MARKET VOLUME, BY GEOGRAPHY, 2015−2022 (KILOTONS) 89
TABLE 27 ASIA PACIFIC CONDUCTIVE GREASE MARKET VALUE BY COUNTRIES, 2015−2022 ($MILLION) 90
TABLE 28 ASIA PACIFIC CONDUCTIVE GREASE MARKET VOLUME BY COUNTRIES, 2015−2022 (KILOTONS) 90
TABLE 29 ASIA PACIFIC CONDUCTIVE GREASE MARKET VALUE, BY TYPES, 2015−2022 ($MILLION) 91
TABLE 30 ASIA PACIFIC CONDUCTIVE GREASE MARKET VOLUME BY TYPES, 2015−2022 (KILOTONS) 91
TABLE 31 ASIA PACIFIC CONDUCTIVE GREASE MARKET VALUE, BY END-USERS, 2015−2022 ($MILLION) 93
TABLE 32 ASIA PACIFIC CONDUCTIVE GREASE MARKET VOLUME, BY END-USERS, 2015−2022 (KILOTONS) 94
TABLE 33 EUROPE CONDUCTIVE GREASE MARKET VALUE BY COUNTRIES, 2015−2022 ($MILLION) 95
TABLE 34 EUROPE CONDUCTIVE GREASE MARKET VOLUME BY COUNTRIES, 2015−2022 (KILOTONS) 96
TABLE 35 EUROPE CONDUCTIVE GREASE MARKET VALUE, BY TYPES, 2015−2022 ($MILLION) 97
TABLE 36 EUROPE CONDUCTIVE GREASE MARKET VOLUME BY TYPES, 2015−2022 (KILOTONS) 97
TABLE 37 EUROPE CONDUCTIVE GREASE MARKET VALUE BY END-USERS, 2015−2022 ($MILLION) 98
TABLE 38 EUROPE CONDUCTIVE GREASE MARKET VOLUME BY END-USERS, 2015−2022 (KILOTONS) 99
TABLE 39 NORTH AMERICA CONDUCTIVE GREASE MARKET VALUE BY COUNTRIES, 2015−2022 ($MILLION) 100
TABLE 40 NORTH AMERICA CONDUCTIVE GREASE MARKET VOLUME BY COUNTRIES, 2015−2022 (KILOTONS) 100
TABLE 41 NORTH AMERICA CONDUCTIVE GREASE MARKET VALUE BY TYPES, 2015−2022 ($MILLION) 101
TABLE 42 NORTH AMERICA CONDUCTIVE GREASE MARKET VOLUME BY TYPE, 2015−2022 (KILOTONS) 101
TABLE 43 NORTH AMERICA CONDUCTIVE GREASE MARKET VALUE BY END-USERS, 2015−2022 ($MILLION) 102
TABLE 44 NORTH AMERICA CONDUCTIVE GREASE MARKET VOLUME BY END-USER, 2015−2022 (KILOTONS) 103
TABLE 45 REST OF THE WORLD CONDUCTIVE GREASE MARKET VALUE BY GEOGRAPHY, 2015−2022 ($MILLION) 104
TABLE 46 REST OF THE WORLD CONDUCTIVE GREASE MARKET VOLUME BY GEOGRAPHY, 2015−2022 (KILOTONS) 104
TABLE 47 REST OF THE WORLD CONDUCTIVE GREASE MARKET VALUE BY TYPES, 2015−2022 ($MILLION) 105
TABLE 48 REST OF THE WORLD REST OF THE WORLD MARKET VOLUME BY TYPES, 2015−2022 (KILOTONS) 106
TABLE 49 REST OF THE WORLD CONDUCTIVE GREASE MARKET VALUE BY END-USERS, 2015−2022 ($MILLION) 107
TABLE 50 REST OF THE WORLD CONDUCTIVE GREASE MARKET VOLUME BY END-USERS, 2015−2022 (KILOTONS) 108
TABLE 51 MERGERS, ACQUISITIONS & JOINT VENTURES, 2013–2017 111
TABLE 52 EXPANSION, 2013–2016 112
TABLE 53 EXHIBITION & PRODUCT LAUNCH 113
TABLE 54 DIVESTMENT & DIVESTITURE, 2016 114
TABLE 55 RESTRUCTURE & REPOSITIONING 114
Research Framework
Infoholic Research works on a holistic 360° approach in order to deliver high quality, validated and reliable information in our market reports. The Market estimation and forecasting involves following steps:
- Data Collation (Primary & Secondary)
- In-house Estimation (Based on proprietary data bases and Models)
- Market Triangulation
- Forecasting

Market related information is congregated from both primary and secondary sources.
Primary sources
Involved participants from all global stakeholders such as Solution providers, service providers, Industry associations, thought leaders etc. across levels such as CXOs, VPs and managers. Plus, our in-house industry experts having decades of industry experience contribute their consulting and advisory services.
Secondary sources
Include public sources such as regulatory frameworks, government IT spending, government demographic indicators, industry association statistics, and company publications along with paid sources such as Factiva, OneSource, Bloomberg among others.
![]()


