
Chatbot Market Analysis by Application (Customer engagement and support, Data Privacy, etc.), By Deployment (Cloud and On-premises), By Verticals (Healthcare, BFSI, Telecom among others), By organization size (Small, medium-sized, and large enterprises), and By Geography (dominated by North America and Europe) – Global Drivers, Restraints, Opportunities, Trends, and Forecast up to 2026
- September, 2020
- Domain: ICT - smart technologies
- Get Free 10% Customization in this Report
A chatbot is an artificial intelligence (AI) driven computer program deployed for interaction. It is commonly known as a ‘conversational agent’ as it simulates human speech for interacting with its user. It enables this communication through texts, audio, or telephone. They can mimic real-life conversations and are therefore used in various sectors such as telecom, healthcare, banking, media, travel & tourism, etc. They play a key role in allowing companies to reach out to their customers to describe the key information of the organization or to resolve queries of the customers by being available 24*7. There has been a rise in its usage as they have multiple advantages that encourage investments in this industry, which in turn boosts its market growth. The market for Chatbots is expected to grow at a CAGR of 29.10%, with a value expecting to reach $16.85 billion by 2026.
Research Methodology:
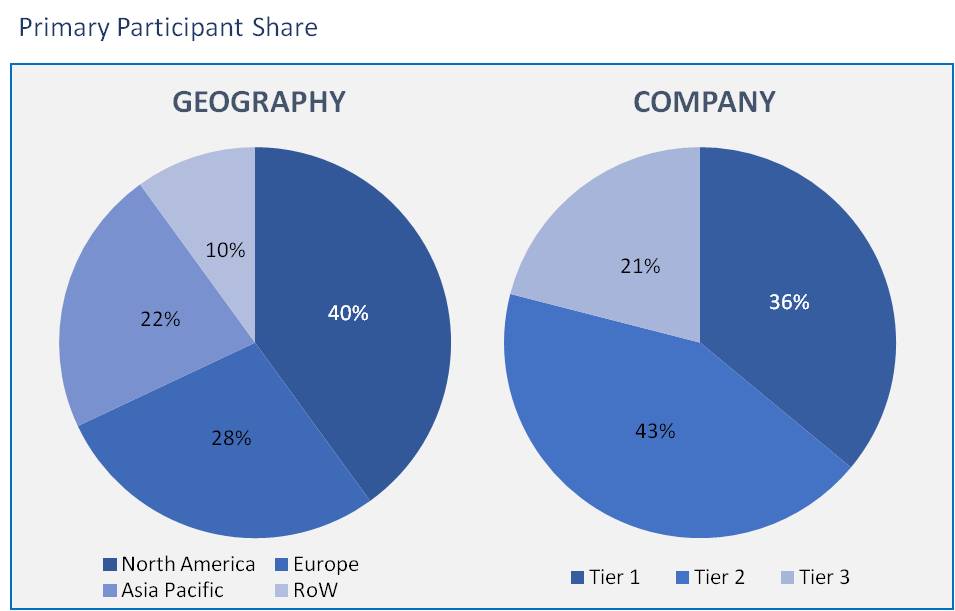
The chatbot market has been analyzed by utilizing the optimum combination of secondary sources and in-house methodology, along with an irreplaceable blend of primary insights. The real-time assessment of the market is an integral part of our market sizing and forecasting methodology. Our industry experts and panel of primary participants have helped in compiling relevant aspects with realistic parametric estimations for a comprehensive study. The participation share of different categories of primary participants is given below:
This report provides an overall understanding of the Chatbot market by carefully analyzing its stakeholders and various domains under it.
- Based on Application
- Customer Engagement
- Customer Support
- Employee Engagement
- Data Privacy and Compliance
- Branding and Advertisement
- Personal Assistant
The Chatbot market based on application mainly comprises customer engagement and support under various verticals. It is an effective tool to engage customers and retain them. It’s also quite useful in collecting data, and also for advertising products and services. The fact that it can be used as a personal assistant is one of the main reasons for its popularity in the present times. These devices have improved the speech recognition considerably by also communicating in the native languages, which has therefore resulted in the wide usage of Chatbots in various applications.
- Based on Deployment
- Cloud
- On-premises
The on-premise deployment model is the most popular one, and it held a dominant market share in 2019 and is expected to maintain this position over the forecast period. The on-premise model allows the companies to have a better user experience and security of data. It can also examine all the Chatbot interactions within the company.
- Based on Verticals
- Healthcare
- Telecom
- BFSI
- Development Sector
- Travel & Tourism
- Media & Entertainment
The banking sector has been one of the main users of chatbots for catering to such large customers and building its relations with them. The other sectors have also adopted Artificial Intelligence tools to focus on bringing customer satisfaction. It is also useful in the healthcare industry for people suffering from diseases such as Alzheimer's.
- Based on Organization size
- Small and Medium-sized Enterprises
- Large Enterprises
Small and Medium-sized enterprises are increasingly shifting towards conversational user interfaces that are possible through Chatbots.
- Based on Region
- North America
- Europe
- Asia-Pacific
- Rest of the world
North America is expected to hold the largest market share during the forecast period. Also, the Asia-pacific region is the emerging market registering high growth, mainly due to the large population base.
There are certain limitations of Chatbots. As Chatbots are fed with specific data sets, it is possible for them to fail to understand or fully cater to the customers’ questions. The use of Chatbot solutions is increasing among various industries; there still remain challenges in effectively utilizing Chatbots solutions mainly due to the limited awareness regarding it. Moreover, the cost of introducing Chatbots in the enterprises is quite high, which might limit the adoption of such systems in Small and Medium-sized Enterprises (SMEs).
Nevertheless, Chatbots are the future of the world. The present COVID induced crises have led to minimum human interaction, and many have chosen the option to continue catering to customer demand by using highly-efficient Chatbots. They are also likely to revolutionize the education sector in the future as more and more learning goes online.
The study also includes the analysis of major players in the Chatbot market. Some of the major players consist of Yellow Messenger, Passage AI, Cognicor, Conversica, Kevit, SmartBots.ai, Kore.ai, Yekaliva, Gupshup, Contus, and Google, among others. This report will also be useful in understanding key market trends and dynamics. The qualitative and quantitative analysis will enhance the user experience of the report.
â— The competitive analysis of the major players enables users to understand various strategies of product innovation, partnerships, and gaining market share.
â— This report also provides the portfolio analysis, capability analysis of the leading players.
â— The quantitative analysis of this market enables users to understand the rationale of the market growth across various domains.
1. Executive Summary
2. Industry Outlook
2.1. Industry Overview
2.2. Industry Trends
3. Market Snapshot
3.1. Total Adressable Market
3.2. Segment Addressable Market
3.2.1. PEST Analysis
3.2.2. Porter Five Forces
3.3. Related Markets
3.4. Ecosystem
4. Market Outlook
4.1. Overview
4.1.1. Market Evolution
4.2. Market Trends and Impact
4.3. Pricing Analysis
4.4. Market Segmentation
4.5. Market Dynamics
4.5.1. Drivers
4.5.2. Restraints
4.5.3. Opportunities
4.6. DRO - Impact Analysis
5. Deployment Model: Market Size & Analysis
5.1. Overview
5.2. On-premises
5.3. Cloud
6. Vertical: Market Size & Analysis
6.1. Overview
6.2. Healthcare
6.3. Telecom
6.4. BFSI
6.5. Development Sector
6.6. Travel and Tourism
6.7. Media and Entertainment
7. Application: Market Size & Analysis
7.1. Overview
7.2. Customer Engagement and Retention
7.3. Data Privacy and Compliance
7.4. Employee Engagement
7.5. Branding and Advertisement
7.6. Personal Assistant
7.7. Customer Support
8. Organization Sizes: Market Size & Analysis
8.1. Overview
8.2. Small and Medium-sized Enterprises
8.3. Large Enterprises
9. Geography: Market Size & Analysis
9.1. Overview
9.2. North America
9.3. Europe
9.4. Asia Pacific
9.5. Rest of the World
10. Competitive Landscape
10.1. Competitor Comparison Analysis
10.2. Market Developments
10.2.1. Mergers and Acquisitions, Legal, Awards, Partnerships
10.2.2. Product Launches and execution
11. Vendor Profiles
11.1. Yellow Messenger
11.1.1. Overview
11.1.2. Business Units
11.1.3. Geographic Revenue
11.1.4. Product Offerings
11.1.5. Developments
11.1.6. Business Strategy
11.2. COGNICOR TECHNOLOGIES
11.2.1. Overview
11.2.2. Business Units
11.2.3. Geographic Revenue
11.2.4. Product Offerings
11.2.5. Developments
11.2.6. Business Strategy
11.3. Conversica
11.3.1. Overview
11.3.2. Business Units
11.3.3. Geographic Revenue
11.3.4. Product Offerings
11.3.5. Developments
11.3.6. Business Strategy
11.4. Gupshup
11.4.1. Overview
11.4.2. Business Units
11.4.3. Geographic Revenue
11.4.4. Product Offerings
11.4.5. Developments
11.4.6. Business Strategy
11.5. Kevit
11.5.1. Overview
11.5.2. Business Units
11.5.3. Geographic Revenue
11.5.4. Product Offerings
11.5.5. Developments
11.5.6. Business Strategy
11.6. YEKALIVA
11.6.1. Overview
11.6.2. Business Units
11.6.3. Geographic Revenue
11.6.4. Product Offerings
11.6.5. Developments
11.6.6. Business Strategy
11.7. Contus
11.7.1. Overview
11.7.2. Business Units
11.7.3. Geographic Revenue
11.7.4. Product Offerings
11.7.5. Developments
11.7.6. Business Strategy
11.8. SMARTBOTS.AI
11.8.1. Overview
11.8.2. Business Units
11.8.3. Geographic Revenue
11.8.4. Product Offerings
11.8.5. Developments
11.8.6. Business Strategy
11.9. Kore.Ai
11.9.1. Overview
11.9.2. Business Units
11.9.3. Geographic Revenue
11.9.4. Product Offerings
11.9.5. Developments
11.9.6. Business Strategy
11.10. Passage AI
11.10.1. Overview
11.10.2. Business Units
11.10.3. Geographic Revenue
11.10.4. Product Offerings
11.10.5. Developments
11.10.6. Business Strategy
12. Companies to Watch
12.1. Landis+Gyr Ag
12.1.1. Overview
12.1.2. Market
12.1.3. Business Strategy
12.2. Aclara Technologies LLC
12.2.1. Overview
12.2.2. Market
12.2.3. Business Strategy
12.3. IBM
12.3.1. Overview
12.3.2. Market
12.3.3. Business Strategy
12.4. Nuance Communications
12.4.1. Overview
12.4.2. Market
12.4.3. Business Strategy
12.5. Google
12.5.1. Overview
12.5.2. Market
12.5.3. Business Strategy
12.6. AWS
12.6.1. Overview
12.6.2. Market
12.6.3. Business Strategy
12.7. Artificial Solutions
12.7.1. Overview
12.7.2. Market
12.7.3. Business Strategy
12.8. Inbenta Technologies
12.8.1. Overview
12.8.2. Market
12.8.3. Business Strategy
13. Analyst Opinion
14. Annexure
14.1. Report Scope
14.2. Market Definitions
14.3. Research Methodology
14.3.1. Data Collation and In-house Estimation
14.3.2. Market Triangulation
14.3.3. Forecasting
14.4. Report Assumptions
14.5. Declarations
14.6. Stakeholders
14.7. Abbreviations
TABLE 1. GLOBAL CHATBOT MARKET VALUE, BY DEPLOYMENT MODEL, 2020-2026 (USD MILLION)
TABLE 2. GLOBAL CHATBOT MARKET VALUE FOR ON-PREMISES, BY GEOGRAPHY, 2020-2026 (USD MILLION)
TABLE 3. GLOBAL CHATBOT MARKET VALUE FOR CLOUD, BY GEOGRAPHY, 2020-2026 (USD MILLION)
TABLE 4. GLOBAL CHATBOT MARKET VALUE, BY VERTICAL, 2020-2026 (USD MILLION)
TABLE 5. GLOBAL CHATBOT MARKET VALUE FOR TELECOM, BY GEOGRAPHY, 2020-2026 (USD MILLION)
TABLE 6. GLOBAL CHATBOT MARKET VALUE FOR HEALTHCARE, BY GEOGRAPHY, 2020-2026 (USD MILLION)
TABLE 7. GLOBAL CHATBOT MARKET VALUE FOR TRAVEL AND TOURISM, BY GEOGRAPHY, 2020-2026 (USD MILLION)
TABLE 8. GLOBAL CHATBOT MARKET VALUE FOR MEDIA AND ENTERTAINMENT, BY GEOGRAPHY, 2020-2026 (USD MILLION)
TABLE 9. GLOBAL CHATBOT MARKET VALUE FOR RETAIL AND ECOMMERCE, BY GEOGRAPHY, 2020-2026 (USD MILLION)
TABLE 10. GLOBAL CHATBOT MARKET VALUE FOR BANKING, FINANCIAL SERVICES AND INSURANCE, BY GEOGRAPHY, 2020-2026 (USD MILLION)
TABLE 11. GLOBAL CHATBOT MARKET VALUE FOR OTHERS, BY GEOGRAPHY, 2020-2026 (USD MILLION)
TABLE 12. GLOBAL CHATBOT MARKET VALUE FOR APPLICATION, BY GEOGRAPHY, 2020-2026 (USD MILLION)
TABLE 13. GLOBAL CHATBOT MARKET VALUE FOR CUSTOMER ENGAGEMENT, BY GEOGRAPHY, 2020-2026 (USD MILLION)
TABLE 14. GLOBAL CHATBOT MARKET VALUE FOR DATA PRIVACY AND COMPLIANCE, BY GEOGRAPHY, 2020-2026 (USD MILLION)
TABLE 15. GLOBAL CHATBOT MARKET VALUE FOR EMPLOYEE ENGAGEMENT, BY GEOGRAPHY, 2020-2026 (USD MILLION)
TABLE 16. GLOBAL CHATBOT MARKET VALUE FOR BRANDING AND ADVERTISEMENT, BY GEOGRAPHY, 2020-2026 (USD MILLION)
TABLE 17. GLOBAL CHATBOT MARKET VALUE, BY ORGANIZATION SIZES, 2020-2026 (USD MILLION)
TABLE 18. GLOBAL CHATBOT MARKET VALUE FOR SMALL AND MEDIUM-SIZED ENTERPRISES, BY GEOGRAPHY, 2020-2026 (USD MILLION)
TABLE 19. GLOBAL CHATBOT MARKET VALUE FOR LARGE ENTERPRISES, BY GEOGRAPHY, 2020-2026 (USD MILLION)
TABLE 20. NORTH AMERICA CHATBOT MARKET VALUE, BY COUNTRY, 2020-2026 (USD MILLION)
TABLE 21. NORTH AMERICA CHATBOT MARKET VALUE, BY DEPLOYMENT MODEL, 2020-2026 (USD MILLION)
TABLE 22. NORTH AMERICA CHATBOT MARKET VALUE, BY VERTICAL, 2020-2026 (USD MILLION)
TABLE 23. NORTH AMERICA CHATBOT MARKET VALUE, BY APPLICATION, 2020-2026 (USD MILLION)
TABLE 24. NORTH AMERICA CHATBOT MARKET VALUE, BY FOR ORGANIZATION SIZES, 2020-2026 (USD MILLION)
TABLE 25. U.S CHATBOT MARKET VALUE, BY DEPLOYMENT MODEL, 2020-2026 (USD MILLION)
TABLE 26. U.S CHATBOT MARKET VALUE, BY VERTICAL, 2020-2026 (USD MILLION)
TABLE 27. U.S CHATBOT MARKET VALUE, BY APPLICATION, 2020-2026 (USD MILLION)
TABLE 28. U.S CHATBOT MARKET VALUE, BY FOR ORGANIZATION SIZES, 2020-2026 (USD MILLION)
TABLE 29. CANADA CHATBOT MARKET VALUE, BY DEPLOYMENT MODEL, 2020-2026 (USD MILLION)
TABLE 30. CANADA CHATBOT MARKET VALUE, BY VERTICAL, 2020-2026 (USD MILLION)
TABLE 31. CANADA CHATBOT MARKET VALUE, BY APPLICATION, 2020-2026 (USD MILLION)
TABLE 32. CANADA CHATBOT MARKET VALUE, BY FOR ORGANIZATION SIZES, 2020-2026 (USD MILLION)
TABLE 33. EUROPE CHATBOT MARKET VALUE, BY COUNTRY, 2020-2026 (USD MILLION)
TABLE 34. EUROPE CHATBOT MARKET VALUE, BY DEPLOYMENT MODEL, 2020-2026 (USD MILLION)
TABLE 35. EUROPE CHATBOT MARKET VALUE, BY VERTICAL, 2020-2026 (USD MILLION)
TABLE 36. EUROPE CHATBOT MARKET VALUE, BY APPLICATION, 2020-2026 (USD MILLION)
TABLE 37. EUROPE CHATBOT MARKET VALUE, BY FOR ORGANIZATION SIZES, 2020-2026 (USD MILLION)
TABLE 38. GERMANY CHATBOT MARKET VALUE, BY DEPLOYMENT MODEL, 2020-2026 (USD MILLION)
TABLE 39. GERMANY CHATBOT MARKET VALUE, BY VERTICAL, 2020-2026 (USD MILLION)
TABLE 40. GERMANY CHATBOT MARKET VALUE, BY APPLICATION, 2020-2026 (USD MILLION)
TABLE 41. GERMANY CHATBOT MARKET VALUE, BY FOR ORGANIZATION SIZES, 2020-2026 (USD MILLION)
TABLE 42. U.K CHATBOT MARKET VALUE, BY DEPLOYMENT MODEL, 2020-2026 (USD MILLION)
TABLE 43. U.K CHATBOT MARKET VALUE, BY VERTICAL, 2020-2026 (USD MILLION)
TABLE 44. U.K CHATBOT MARKET VALUE, BY APPLICATION, 2020-2026 (USD MILLION)
TABLE 45. U.K CHATBOT MARKET VALUE, BY FOR ORGANIZATION SIZES, 2020-2026 (USD MILLION)
TABLE 46. FRANCE CHATBOT MARKET VALUE, BY DEPLOYMENT MODEL, 2020-2026 (USD MILLION)
TABLE 47. FRANCE CHATBOT MARKET VALUE, BY VERTICAL, 2020-2026 (USD MILLION)
TABLE 48. FRANCE CHATBOT MARKET VALUE, BY APPLICATION, 2020-2026 (USD MILLION)
TABLE 49. FRANCE CHATBOT MARKET VALUE, BY FOR ORGANIZATION SIZES, 2020-2026 (USD MILLION)
TABLE 50. ROE CHATBOT MARKET VALUE, BY DEPLOYMENT MODEL, 2020-2026 (USD MILLION)
TABLE 51. ROE CHATBOT MARKET VALUE, BY VERTICAL, 2020-2026 (USD MILLION)
TABLE 52. ROE CHATBOT MARKET VALUE, BY APPLICATION, 2020-2026 (USD MILLION)
TABLE 53. ROE CHATBOT MARKET VALUE, BY FOR ORGANIZATION SIZES, 2020-2026 (USD MILLION)
TABLE 54. ASIA PACIFIC CHATBOT MARKET VALUE, BY COUNTRY, 2020-2026 (USD MILLION)
TABLE 55. ASIA PACIFIC CHATBOT MARKET VALUE, BY DEPLOYMENT MODEL, 2020-2026 (USD MILLION)
TABLE 56. ASIA PACIFIC CHATBOT MARKET VALUE, BY VERTICAL, 2020-2026 (USD MILLION)
TABLE 57. ASIA PACIFIC CHATBOT MARKET VALUE, BY APPLICATION, 2020-2026 (USD MILLION)
TABLE 58. ASIA PACIFIC CHATBOT MARKET VALUE, BY FOR ORGANIZATION SIZES, 2020-2026 (USD MILLION)
TABLE 59. CHINA CHATBOT MARKET VALUE, BY DEPLOYMENT MODEL, 2020-2026 (USD MILLION)
TABLE 60. CHINA CHATBOT MARKET VALUE, BY VERTICAL, 2020-2026 (USD MILLION)
TABLE 61. CHINA CHATBOT MARKET VALUE, BY APPLICATION, 2020-2026 (USD MILLION)
TABLE 62. CHINA CHATBOT MARKET VALUE, BY FOR ORGANIZATION SIZES, 2020-2026 (USD MILLION)
TABLE 63. INDIA CHATBOT MARKET VALUE, BY DEPLOYMENT MODEL, 2020-2026 (USD MILLION)
TABLE 64. INDIA CHATBOT MARKET VALUE, BY VERTICAL, 2020-2026 (USD MILLION)
TABLE 65. INDIA CHATBOT MARKET VALUE, BY APPLICATION, 2020-2026 (USD MILLION)
TABLE 66. INDIA CHATBOT MARKET VALUE, BY FOR ORGANIZATION SIZES, 2020-2026 (USD MILLION)
TABLE 67. JAPAN CHATBOT MARKET VALUE, BY DEPLOYMENT MODEL, 2020-2026 (USD MILLION)
TABLE 68. JAPAN CHATBOT MARKET VALUE, BY VERTICAL, 2020-2026 (USD MILLION)
TABLE 69. JAPAN CHATBOT MARKET VALUE, BY APPLICATION, 2020-2026 (USD MILLION)
TABLE 70. JAPAN CHATBOT MARKET VALUE, BY FOR ORGANIZATION SIZES, 2020-2026 (USD MILLION)
TABLE 71. ROE CHATBOT MARKET VALUE, BY DEPLOYMENT MODEL, 2020-2026 (USD MILLION)
TABLE 72. ROE CHATBOT MARKET VALUE, BY VERTICAL, 2020-2026 (USD MILLION)
TABLE 73. ROE CHATBOT MARKET VALUE, BY APPLICATION, 2020-2026 (USD MILLION)
TABLE 74. ROE CHATBOT MARKET VALUE, BY FOR ORGANIZATION SIZES, 2020-2026 (USD MILLION)
TABLE 75. REST OF WORLD CHATBOT MARKET VALUE, BY DEPLOYMENT MODEL, 2020-2026 (USD MILLION)
TABLE 76. REST OF WORLD CHATBOT MARKET VALUE, BY VERTICAL, 2020-2026 (USD MILLION)
TABLE 77. REST OF WORLD CHATBOT MARKET VALUE, BY APPLICATION, 2020-2026 (USD MILLION)
TABLE 78. REST OF WORLD CHATBOT MARKET VALUE, BY FOR ORGANIZATION SIZES, 2020-2026 (USD MILLION)
TABLE 79. YELLOW MESSENGER.: OVERVIEW
TABLE 80. YELLOW MESSENGER.: STRATEGIC SNAPSHOT
TABLE 81. YELLOW MESSENGER.: BUSINESS OPPORTUNITIES AND OUTLOOK
TABLE 82. YELLOW MESSENGER.: PRODUCT/SERVICE PORTFOLIO
TABLE 83. COGNICOR TECHNOLOGIES: OVERVIEW
TABLE 84. COGNICOR TECHNOLOGIES: STRATEGIC SNAPSHOT
TABLE 85. COGNICOR TECHNOLOGIES: BUSINESS OPPORTUNITIES AND OUTLOOK
TABLE 86. COGNICOR TECHNOLOGIES: PRODUCT/SERVICE PORTFOLIO
TABLE 87. CONVERSICA: OVERVIEW
TABLE 88. CONVERSICA: STRATEGIC SNAPSHOT
TABLE 89. CONVERSICA: BUSINESS OPPORTUNITIES AND OUTLOOK
TABLE 90. CONVERSICA: PRODUCT/SERVICE PORTFOLIO
TABLE 91. GUPSHUP.: OVERVIEW
TABLE 92. GUPSHUP.: STRATEGIC SNAPSHOT
TABLE 93. GUPSHUP.: BUSINESS OPPORTUNITIES AND OUTLOOK
TABLE 94. GUPSHUP.: PRODUCT/SERVICE PORTFOLIO
TABLE 95. KEVIT: OVERVIEW
TABLE 96. KEVIT: STRATEGIC SNAPSHOT
TABLE 97. KEVIT: BUSINESS OPPORTUNITIES AND OUTLOOK
TABLE 98. KEVIT: PRODUCT/SERVICE PORTFOLIO
TABLE 99. YEKALIVA.: OVERVIEW
TABLE 100. YEKALIVA.: STRATEGIC SNAPSHOT
TABLE 101. YEKALIVA.: BUSINESS OPPORTUNITIES AND OUTLOOK
TABLE 102. YEKALIVA.: PRODUCT/SERVICE PORTFOLIO
TABLE 103. CONTUS: OVERVIEW
TABLE 104. CONTUS: STRATEGIC SNAPSHOT
TABLE 105. CONTUS: BUSINESS OPPORTUNITIES AND OUTLOOK
TABLE 106. CONTUS: PRODUCT/SERVICE PORTFOLIO
TABLE 107. SMARTBOTS.AI.: OVERVIEW
TABLE 108. SMARTBOTS.AI.: STRATEGIC SNAPSHOT
TABLE 109. SMARTBOTS.AI.: BUSINESS OPPORTUNITIES AND OUTLOOK
TABLE 110. SMARTBOTS.AI.: PRODUCT/SERVICE PORTFOLIO
TABLE 111. KORE.AI: OVERVIEW
TABLE 112. KORE.AI: STRATEGIC SNAPSHOT
TABLE 113. KORE.AI: BUSINESS OPPORTUNITIES AND OUTLOOK
TABLE 114. KORE.AI: PRODUCT/SERVICE PORTFOLIO
TABLE 115. MACHINESHOP.: OVERVIEW
TABLE 116. MACHINESHOP.: STRATEGIC SNAPSHOT
TABLE 117. MACHINESHOP.: BUSINESS OPPORTUNITIES AND OUTLO
TABLE 118. MACHINESHOP.: PRODUCT/SERVICE PORTFOLIO
Research Framework
Infoholic Research works on a holistic 360° approach in order to deliver high quality, validated and reliable information in our market reports. The Market estimation and forecasting involves following steps:
- Data Collation (Primary & Secondary)
- In-house Estimation (Based on proprietary data bases and Models)
- Market Triangulation
- Forecasting

Market related information is congregated from both primary and secondary sources.
Primary sources
Involved participants from all global stakeholders such as Solution providers, service providers, Industry associations, thought leaders etc. across levels such as CXOs, VPs and managers. Plus, our in-house industry experts having decades of industry experience contribute their consulting and advisory services.
Secondary sources
Include public sources such as regulatory frameworks, government IT spending, government demographic indicators, industry association statistics, and company publications along with paid sources such as Factiva, OneSource, Bloomberg among others.
![]()


