
Biostimulants Market By Application (Foliar, Soil, Seed), By Active Ingredients (Amino Acid & Derivatives, Humic Acid & Fulvic Acid, Seaweed extracts, and Microbial Amendments), By Crop and By Geography – Global Drivers, Restraints, Opportunities, Trends, and Forecast to 2025
- February, 2020
- Domain: Chemicals, Materials & Food - Agro, Pharma, Food & Personal Care
- Get Free 10% Customization in this Report
Overview
Plant biostimulants are technically the substance(s) and micro-organisms, which improve the plant health, productivity, and/or tolerance via stimulating the plant functions when applied. The market for such products is still in its nascent stage by serving a very small portion of its potential market. Biostimulants were first formally introduced in the 1990s and the market has been growing since.
According to Infoholic Research, the market for biostimulants would reach $5.33 billion by 2025, growing at a CAGR of 11.6% during the forecast period 2019–2025, owing to increasing regulatory accommodation and transitioning consumer trends towards healthier food alternatives.
Research Methodology:
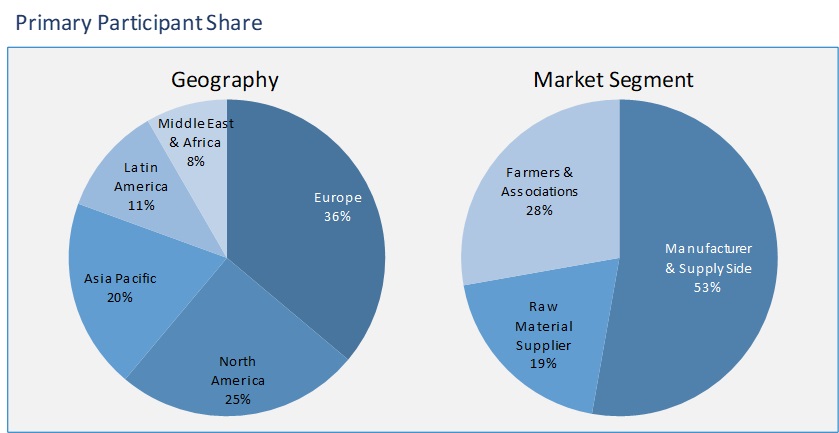
The biostimulants market has been analyzed by utilizing the optimum combination of secondary sources and in-house methodology, along with an irreplaceable blend of primary insights. The real-time assessment of the market is an integral part of our market sizing and forecasting methodology. Our industry experts and panel of primary participants have helped in compiling relevant aspects with realistic parametric estimations for a comprehensive study. The participation share of different categories of primary participants is given below:
Key Market Insights
Biostimulants have not been recognized in regulatory till recently, which resulted in limited market penetration of the products in potential markets. This was largely due to the lack of clarity on the categorization of these products. Some of these products were classified with fertilizers, while others were categorized under crop protection chemicals. Further, as the biostimulants were not recognized by many governments, as a result, there were labeling problems for these products in different countries.
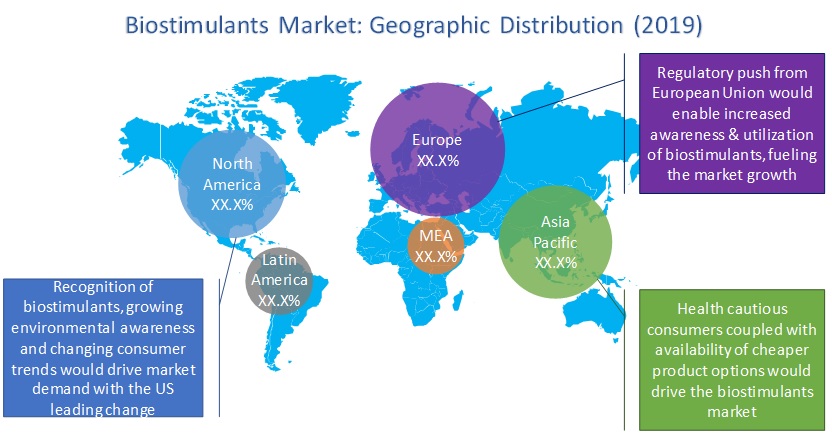
The market of biostimulants has been witnessing strong growth largely owing to the characteristic benefits of reducing agrochemical usage, improvement of crop quality, and increase in overall yield. European farmers have been at the forefront of the market adoption, where the focus is not only on increasing the crop yield but also on improving the crop quality. Some of the countries actively adopted the biostimulants at the country level, allowing the biostimulants product growth. However, most of the developing countries, especially in Central & Eastern Europe, were lagging and resulted in limited penetration of biostimulant products in the region. On the other hand, the US market has been receptive towards the biostimulants, although the absence of regulatory details curtails the market scope.
The inclusion of biostimulants within the regulatory framework will further facilitate the growth of the biostimulants market within the European Union, while other major markets are taking que from the EU for adapting biostimulants within their policy frameworks. The US market included biostimulant definition in April 2018 for the first time and currently present in draft guidance on FIFRA applicability. The European market would continue to dominate the market revenue for biostimulants during the forecast period, while Asia Pacific will project the highest CAGR during the forecast period. The US market for biostimulants is expected to gain pace from 2021 to mark double-digit growth during the forecast period.
Foliar application mode will remain the most preferential mode continuing the current trend, while seed treatment will gain attention and will be able to project a better growth rate during the forecast period. Increasing consumer demand for healthier fruits & vegetables will enable the crop category to retain the top position in the biostimulants market with the following category of cereals & grains segment.
The study of the biostimulants market provides the market size information and market trends along with the factors and parameters impacting it in both short- and long-term. The study also covers the competitive scenario of the market, major players with their branding strategies, and differentiating factors among others. The study ensures a 360° view, bringing out the complete key insights of the competitive industry. These insights are intended to help the business decision makers to make better business plans and informed decisions for the future growth. In addition, the study helps venture capitalists in understanding the companies better and take informed decisions.
The competitive scenario of the market is open with numerous companies competing with each other, although the level of rivalry is not that high, given the nascent market and high growth opportunities. Most of the prominent players offer biostimulant products which they have acquired from internal development or from inorganic growth options. Few of the key companies active in the field are BASF, Bayer, Syngenta, FMC Corporation, Valagro, Adama, Solvay, Ajinomoto, Stroller Group, Koppert Biological Systems, and Lallemand Inc.
Report Scope:
- Application Mode
- Foliar
- Soil
- Seeds
- Active Ingredients
- Amino Acid & Derivatives
- Humic Acid & Fulvic Acid
- Seaweed Extracts
- Microbial Amendments
- Others (such as Vitamins)
- Crops
- Fruits & Vegetables
- Cereals & Grains
- Turf & Ornamental
- Pulses & Oilseeds
- Others
- Geographies
- Europe
- North America
- Asia Pacific
- Latin America
- Middle East & Africa
- Industry outlook: market trends and drivers, restraints, and opportunities
- Executive Summary
- Regulatory Driven Europe & Health Cautious Asia will Lead Market Growth
- All Around Growth Would Maintain Segment Mix
- Market Positioning
- Industry Snapshot
- Industry Overview
- Key Trends
- Related Markets
- Industry Snapshot
- Market Outlook
- Introduction
- Role of Biostimulants
- Value Chain Analysis
- Market Segmentation
- Introduction
- Market Characteristics
- PESTLE Analysis
- Porter’s Five Force Analysis
- Market Dynamics
- Drivers
- Regulatory inclusion paving the way for better awareness & market growth
- Environmental & health benefits to expand plant biostimulants market with health cautious consumers
- Growing incomes & decreasing pricing increasing affordability, thus pushing market growth
- Restraints
- Lack of awareness consumer awareness limits the market potential
- High initial cost limits the market penetration, especially in price sensitive developing countries
- Opportunities
- Large potential market in Europe & the US opened via regulatory changes
- Growing connectivity & advanced agricultural technology developments supplementing the biostimulants growth
- DRO – Impact Analysis
- Drivers
- Patent Analysis
- Biostimulants Market, By Application
- Overview
- Foliar
- Soil
- Seeds
- Biostimulants Market, By Active Ingredient
- Overview
- Amino Acid & Derivatives
- Humic Acid & Fulvic Acid
- Seaweed Extracts
- Microbial Amendments
- Biostimulants Market, By Crop
- Overview
- Fruits & Vegetables
- Cereals & Grains
- Turf & Ornamental Crops
- Pulses & Oilseeds
- Biostimulants Market, By Geography
- Overview
- Asia Pacific
- Asia Pacific Biostimulants Market, By Country
- Asia Pacific Biostimulants Market, By Application
- Asia Pacific Biostimulants Market, By Active Ingredient
- Asia Pacific Biostimulants Market, By Crop
- North America
- North America Biostimulants Market, By Country
- North America Biostimulants Market, By Application
- North America Biostimulants Market, By Active Ingredient
- North America Biostimulants Market, By Crop
- Europe
- Europe Biostimulants Market, By Country
- Europe Biostimulants Market, By Application
- Europe Biostimulants Market, By Active Ingredient
- Europe Biostimulants Market, By Crop
- Middle East & Africa
- Middle East & Africa Biostimulants Market, By Country
- Middle East & Africa Biostimulants Market, By Application
- Middle East & Africa Biostimulants Market, By Active Ingredient
- Middle East & Africa Biostimulants Market, By Crop
- Latin America
- Latin America Biostimulants Market, By Country
- Latin America Biostimulants Market, By Application
- Latin America Biostimulants Market, By Active Ingredient
- Latin America Biostimulants Market, By Crop
- Competitive Landscape
- Competitive Regional Exposure Analysis
- Vendors Profile
- BASF SE
- Analyst Opinion
- Business Analysis
- Strategic Snapshot
- Business Impact Analysis
- Product/Service Portfolio
- SWOT Analysis
- BAYER AG
- Analyst Opinion
- Business Analysis
- Strategic Snapshot
- Business Impact Analysis
- Product/Service Portfolio
- SWOT Analysis
- Syngenta
- Analyst Opinion
- Business Analysis
- Strategic Snapshot
- Business Impact Analysis
- Product/Service Portfolio
- SWOT Analysis
- FMC Corporation
- Analyst Opinion
- Business Analysis
- Strategic Snapshot
- Business Impact Analysis
- Product/Service Portfolio
- SWOT Analysis
- Valagro
- Analyst Opinion
- Business Analysis
- Strategic Snapshot
- Business Impact Analysis
- Product/Service Portfolio
- SWOT Analysis
- ADAMA Ltd
- Analyst Opinion
- Business Analysis
- Strategic Snapshot
- Business Impact Analysis
- Product/Service Portfolio
- SWOT Analysis
- Solvay
- Analyst Opinion
- Business Analysis
- Strategic Snapshot
- Business Impact Analysis
- Product/Service Portfolio
- SWOT Analysis
- AJINOMOTO CO., INC
- Analyst Opinion
- Business Analysis
- Strategic Snapshot
- Business Impact Analysis
- Product/Service Portfolio
- SWOT Analysis
- Stoller Group
- Analyst Opinion
- Business Analysis
- Strategic Snapshot
- Business Impact Analysis
- Product/Service Portfolio
- SWOT Analysis
- KOPPERT BIOLOGICAL SYSTEMS
- Analyst Opinion
- Business Analysis
- Strategic Snapshot
- Business Impact Analysis
- Product/Service Portfolio
- SWOT Analysis
- LALLEMAND INC
- Analyst Opinion
- Business Analysis
- Strategic Snapshot
- Business Impact Analysis
- Product/Service Portfolio
- SWOT Analysis
- BASF SE
- Annexure
- Report Scope
- Market Definition
- Research Methodology
- Data Collation & In-house Estimation
- Market Triangulation
- Forecasting
- Study Declarations
- Report Assumptions
- Stakeholders
- Abbreviations
TABLE 1 Global Biostimulants market Value, By applications, 2018–2025 ($Million)
TABLE 2 Global Biostimulants Market Volume, By APPLICATIONS, 2018–2025 (KILOTONS)
TABLE 3 Global Biostimulants For Foliar Market Value, By Geography, 2018–2025 ($Million)
TABLE 4 Global Biostimulants For Foliar Market Volume, By Geography, 2018–2025 (KILOTONS)
TABLE 5 Global Biostimulants For Soil Market Value, By Geography, 2018–2025 ($Million)
TABLE 6 Global Biostimulants For Soil Market Volume, By Geography, 2018–2025 (KILOTONS)
TABLE 7 Global Biostimulants For Seeds Market Value, By Geography, 2018–2025 ($Million)
TABLE 8 Global Biostimulants For Seeds Market Volume, By Geography, 2018–2025 (KILOTONS)
TABLE 9 Global Biostimulants Market Value, By Active Ingredient, 2018–2025 ($Million)
TABLE 10 Global Biostimulants Market Volume, By Active Ingredient, 2018–2025 (KILOTONS)
TABLE 11 Global Amino Acid & Derivatives Based Biostimulants Market Value, By Geography, 2018–2025 ($Million)
TABLE 12 Global Amino Acid & Derivatives Based Biostimulants Market Volume, By Geography, 2018–2025 (KILOTONS)
TABLE 13 Global Humic Acid & Fulvic Acid Based Biostimulants Market Value, By Geography, 2018–2025 ($Million)
TABLE 14 Global Humic Acid & Fulvic Acid Based Biostimulants MARKET Volume, By Geography, 2018–2025 (KILOTONS)
TABLE 15 Global Seaweed Extracts Based Biostimulants Market Value, By Geography, 2018–2025 ($Million)
TABLE 16 Global Seaweed Extracts Based Biostimulants MARKET Volume, By Geography, 2018–2025 (KILOTONS)
TABLE 17 Global Microbial Amendments Based Biostimulants Market Value, By Geography, 2018–2025 ($Million)
TABLE 18 Global Microbial Amendments Based Biostimulants Market Volume, By Geography, 2018–2025 (KILOTONS)
TABLE 19 Global Biostimulants market Value, By Crop, 2018–2025 ($Million)
TABLE 20 Global Biostimulants Market Volume, By Crop, 2018–2025 (KILOTONS)
TABLE 21 Global Biostimulants For Fruits & Vegetables Market Value, By Geography, 2018–2025 ($Million)
TABLE 22 Global Biostimulants For Fruits & Vegetables Market Volume, By Geography, 2018–2025 (KILOTONS)
TABLE 23 Global Biostimulants market For Cereals & Grains Market Value, By Geography, 2018–2025 ($Million)
TABLE 24 Global Biostimulants market For Cereals & Grains Market Volume, By Geography, 2018–2025 (KILOTONS)
TABLE 25 Global Biostimulants For Turf & Ornamental Crops Market Value, By Geography, 2018–2025 ($Million)
TABLE 26 Global Biostimulants For Turf & Ornamental Crops Market Volume, By Geography, 2018–2025 (KILOTONS)
TABLE 27 Global Biostimulants For Pulses & Oilseeds Market Value, By Geography, 2018–2025 ($Million)
TABLE 28 Global Biostimulants For Pulses & Oilseeds Market Volume, By Geography, 2018–2025 (KILOTONS)
TABLE 29 Global Biostimulants Market Value, By Geography, 2018–2025 ($Million)
TABLE 30 Global Biostimulants Market Volume, By Geography, 2018–2025 (KILOTONS)
TABLE 31 Asia Pacific Biostimulants MARKET Value, By Geography, 2018–2025 ($Million)
TABLE 32 Asia Pacific Biostimulants MARKET Volume, By Geography, 2018–2025 (KILOTONS)
TABLE 33 Asia Pacific Biostimulants Market Value, By Application, 2018–2025 ($Million)
TABLE 34 Asia Pacific Biostimulants Market Volume, By Application, 2018–2025 (KILOTONS)
TABLE 35 Asia Pacific Biostimulants Market Value, By Active Ingredient, 2018–2025 ($Million)
TABLE 36 Asia Pacific Biostimulants Market Volume, By Active Ingredient, 2018–2025 (KILOTONS)
TABLE 37 Asia Pacific Biostimulants Market Value, By Crop, 2018–2025 ($Million)
TABLE 38 Asia Pacific Biostimulants Market Volume, By Crop, 2018–2025 (KILOTONS)
TABLE 39 North America biostimulants Market Value, By Geography, 2018–2025 ($Million)
TABLE 40 North America biostimulants Market Volume, By Geography, 2018–2025 (KILOTONS)
TABLE 41 North America biostimulants Market Value, By Application, 2018–2025 ($Million)
TABLE 42 North America biostimulants Market Volume, By Application, 2018–2025 (KILOTONS)
TABLE 43 North America biostimulants Market Value, By Active Ingredient, 2018–2025 ($Million)
TABLE 44 North America biostimulants Market Volume, By Active Ingredient, 2018–2025 (KILOTONS)
TABLE 45 North America biostimulants Market Value, By Crop, 2018–2025 ($Million)
TABLE 46 North America biostimulants Market Volume, By Crop, 2018–2025 (KILOTONS)
TABLE 47 Europe biostimulants Market Value, By Geography, 2018–2025 ($Million)
TABLE 48 Europe biostimulants Market Volume, By Geography, 2018–2025 (KILOTONS)
TABLE 49 Europe Biostimulants Market Value, By Application, 2018–2025 ($Million)
TABLE 50 Europe Biostimulants Market Volume, By Application, 2018–2025 (KILOTONS)
TABLE 51 Europe Biostimulants market Value, By Active Ingredient, 2018–2025 ($Million)
TABLE 52 Europe Biostimulants Market Volume, By Active Ingredient, 2018–2025 (KILOTONS)
TABLE 53 Europe Biostimulants market Value, By Crop, 2018–2025 ($Million)
TABLE 54 Europe Biostimulants Market Volume, By Crop, 2018–2025 (KILOTONS)
TABLE 55 Middle East & Africa biostimulants Market Value, By Geography, 2018–2025 ($Million)
TABLE 56 Middle East & Africa biostimulants Market Volume, By Geography, 2018–2025 (KILOTONS)
TABLE 57 Middle East & Africa Biostimulants Market Value, By Application, 2018–2025 ($Million)
TABLE 58 Middle East & Africa Biostimulants Market Volume, By Application, 2018–2025 (KILOTONS)
TABLE 59 Middle East & Africa Biostimulants Market Value, By Active Ingredient, 2018–2025 ($Million)
TABLE 60 Middle East & Africa biostimulants Market Volume, By Active Ingredient, 2018–2025 (KILOTONS)
TABLE 61 Middle East & Africa Biostimulants Market Value, By Crop, 2018–2025 ($Million)
TABLE 62 Middle East & Africa biostimulants Market Volume, By Crop, 2018–2025 (KILOTONS)
TABLE 63 Latin America biostimulants Market Value, By Geography, 2018–2025 ($Million)
TABLE 64 Latin America biostimulants Market Volume, By Geography, 2018–2025 (KILOTONS)
TABLE 65 Latin America Biostimulants Market Value, By Application, 2018–2025 ($Million)
TABLE 66 Latin America Biostimulants Market Volume, By Application, 2018–2025 (KILOTONS)
TABLE 67 Latin America Biostimulants Market Value, By Active Ingredient, 2018–2025 ($Million)
TABLE 68 Latin America biostimulants Market Volume, By Active Ingredient, 2018–2025 (KILOTONS)
TABLE 69 Latin America Biostimulants Market Value, By Crop, 2018–2025 ($Million)
TABLE 70 Latin America biostimulants Market Volume, By Crop, 2018–2025 (KILOTONS)
TABLE 71 BASF SE: OVERVIEW
TABLE 72 BASF SE: strategic snapshot
TABLE 73 BASF SE: business opportunities and outlook
TABLE 74 BASF SE: Product/service portfolio
TABLE 75 BAYER AG: OVERVIEW
TABLE 76 BAYER AG: strategic snapshot
TABLE 77 BAYER AG: business opportunities and outlook
TABLE 78 BAYER AG: Product/service portfolio
TABLE 79 Syngenta: OVERVIEW
TABLE 80 SYNGENTA: strategic snapshot
TABLE 81 SYNGENTA: business opportunities and outlook
TABLE 82 SYNGENTA: Product/service portfolio
TABLE 83 FMC Corporation: OVERVIEW
TABLE 84 FMC Corporation: strategic snapshot
TABLE 85 FMC Corporation: business opportunities and outlook
TABLE 86 FMC Corporation: Product/service portfolio
TABLE 87 Valagro: OVERVIEW
TABLE 88 Valagro: strategic snapshot
TABLE 89 Valagro: business opportunities and outlook
TABLE 90 Valagro: Product/service portfolio
TABLE 91 ADAMA LTD: OVERVIEW
TABLE 92 ADAMA LTD: strategic snapshot
TABLE 93 ADAMA LTD: business opportunities and outlook
TABLE 94 ADAMA LTD: Product/service portfolio
TABLE 95 SOLVAY: OVERVIEW
TABLE 96 SOLVAY: STRATEGIC snapshot
TABLE 97 Solvay.: business opportunities and outlook
TABLE 98 Solvay.: Product/service portfolio
TABLE 99 AJINOMOTO CO., INC: OVERVIEW
TABLE 100 AJINOMOTO CO., INC: STRATEGIC snapshot
TABLE 101 AJINOMOTO CO., INC: business opportunities and outlook
TABLE 102 AJINOMOTO CO., INC: Product/service portfolio
TABLE 103 Stoller Group: OVERVIEW
TABLE 104 Stoller Group: STRATEGIC snapshot
TABLE 105 Stoller Group: business opportunities and outlook
TABLE 106 Stoller Group: Product/service portfolio
TABLE 107 Koppert Biological Systems: OVERVIEW
TABLE 108 Koppert Biological Systems: STRATEGIC snapshot
TABLE 109 Koppert Biological Systems: business opportunities and outlook
TABLE 110 Koppert Biological Systems: Product/service portfolio
TABLE 111 LALLEMAND INC: OVERVIEW
TABLE 112 LALLEMAND INC: STRATEGIC snapshot
TABLE 113 LALLEMAND INC: business opportunities and outlook
TABLE 114 LALLEMAND INC: Product/service portfolio
Research Framework
Infoholic Research works on a holistic 360° approach in order to deliver high quality, validated and reliable information in our market reports. The Market estimation and forecasting involves following steps:
- Data Collation (Primary & Secondary)
- In-house Estimation (Based on proprietary data bases and Models)
- Market Triangulation
- Forecasting

Market related information is congregated from both primary and secondary sources.
Primary sources
Involved participants from all global stakeholders such as Solution providers, service providers, Industry associations, thought leaders etc. across levels such as CXOs, VPs and managers. Plus, our in-house industry experts having decades of industry experience contribute their consulting and advisory services.
Secondary sources
Include public sources such as regulatory frameworks, government IT spending, government demographic indicators, industry association statistics, and company publications along with paid sources such as Factiva, OneSource, Bloomberg among others.
![]()


