
Base Oil Market: Based on Type (Group I, II, III, IV, V), Application (Automotive Oil, Industrial Oil, Metalworking Fluids, Hydraulic Oil, Greases, and Others), Geography (North America, Europe, Asia-pacific, and Rest of World), size, key players, trend and opportunities- Forecast up to 2026
- September, 2020
- Domain: Chemicals, Materials & Food - Petrochemicals
- Get Free 10% Customization in this Report
The base oil is extracted from heating the crude oil, and the process is known as refining and is subject to a required set of specifications. The base oil is characteristically termed as lubricant base stock. The quality of a lubricant depends on the type of base oil used and the method of production used to produce the base oil. It is critical toward the grade of lubricant as base oils usually make up to 70-97% of the formulation of lubricants. Volatility in prices of crude oil restraints the base oil market with the potential disruption in the supply of oil and gas by events affecting the prices of crude oil. These include geopolitical and weather-related issues. For example, the Middle East, which has a prominent market share in the oil and gas industry but is highly volatile due to political issues. Since crude oil is a raw material directly used to produce base oil, price fluctuation is directly reflected in base oil prices. Global Base Oil Market was predicted to reach $44.3 billion by 2026 from $41.7 billion in 2020, recording a CAGR of 1.0% during the forecast period.
Base Oil Market Key Segments:
By Type
- Group I
- Group II
- Group III
- Group IV
- Group V
By Application
- Automotive Oil
- Industrial Oil
- Metalworking Fluids
- Hydraulic Oil
- Greases
- Others
By Geography
- North America
- Europe
- Asia-Pacific
- Rest of World
Research Methodology:
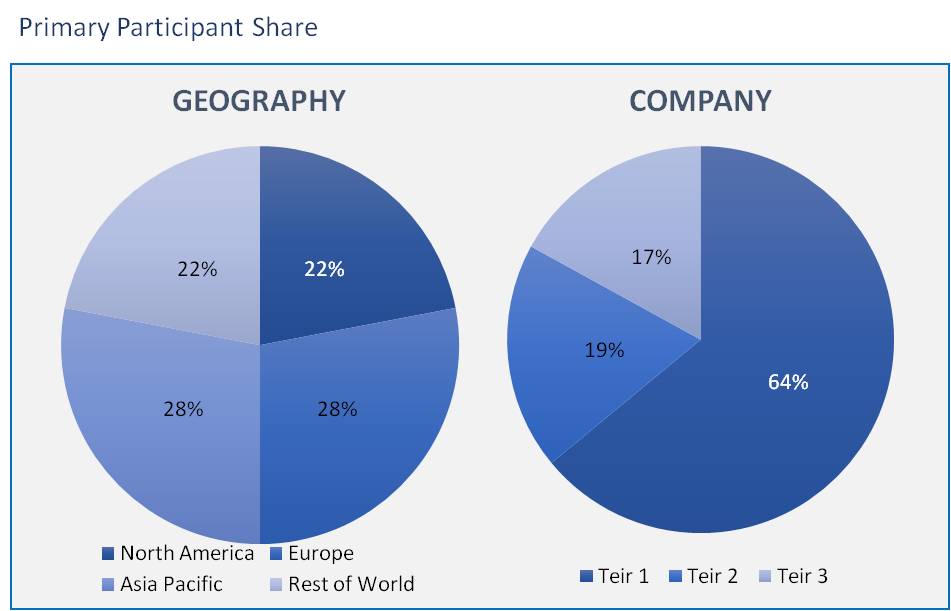
The base oil market has been analyzed by utilizing the optimum combination of secondary sources and in-house methodology, along with an irreplaceable blend of primary insights. The real-time assessment of the market is an integral part of our market sizing and forecasting methodology. Our industry experts and panel of primary participants have helped in compiling relevant aspects with realistic parametric estimations for a comprehensive study. The participation share of different categories of primary participants is given below:
Growth in Demand for Group II, and III Base Oils
- In the last few years, demand for Group I base oils have been decreasing regularly, and the production volume for Group II, III, and IV oils has been proliferating.
- The rise in Demand for high-solvency power-based oils is high in various industrial applications, where solvency is crucial. The lubricant industry needs high viscosity plus high solvency due to the requirement for high additive load in preparations. Group I paraffin has low solvency power; therefore, the demand for Group 1 base oil demand is decreasing.
- In addition, Group II, III, and IV oils have higher solvency power than that of Group I oils. Thus, Group II and III base oils are preferable for use in the formulation of lubricants, specifically for passenger cars, heavy-duty vehicles, and automatic transmission engines. This, in turn, would uplift the global base oil market during the forecast period.
Automotive Fluids Consisted of a Significant Share
- Based on the application, the global base oil market has been segmented into automotive fluids, industrial oils, metalworking fluids, hydraulic oils, greases, and others. The automotive fluids segment consisted of a significant share of the global base oil market in 2019. Base oils are widely used to manufacture lubricants in the automotive industry. Lubricants have a significant role in the automotive engine, transmission, and steering mechanisms by minimizing friction and heat generation.
- Hydraulic oils are another significant segment of the global base oil market and are widely used in excavators, backhoes power steering systems, transmissions, garbage trucks, aircraft flight control systems, and brakes. These provide excellent thermal low pour points, high viscosity index, oxidation stability, and superior heat transfer.
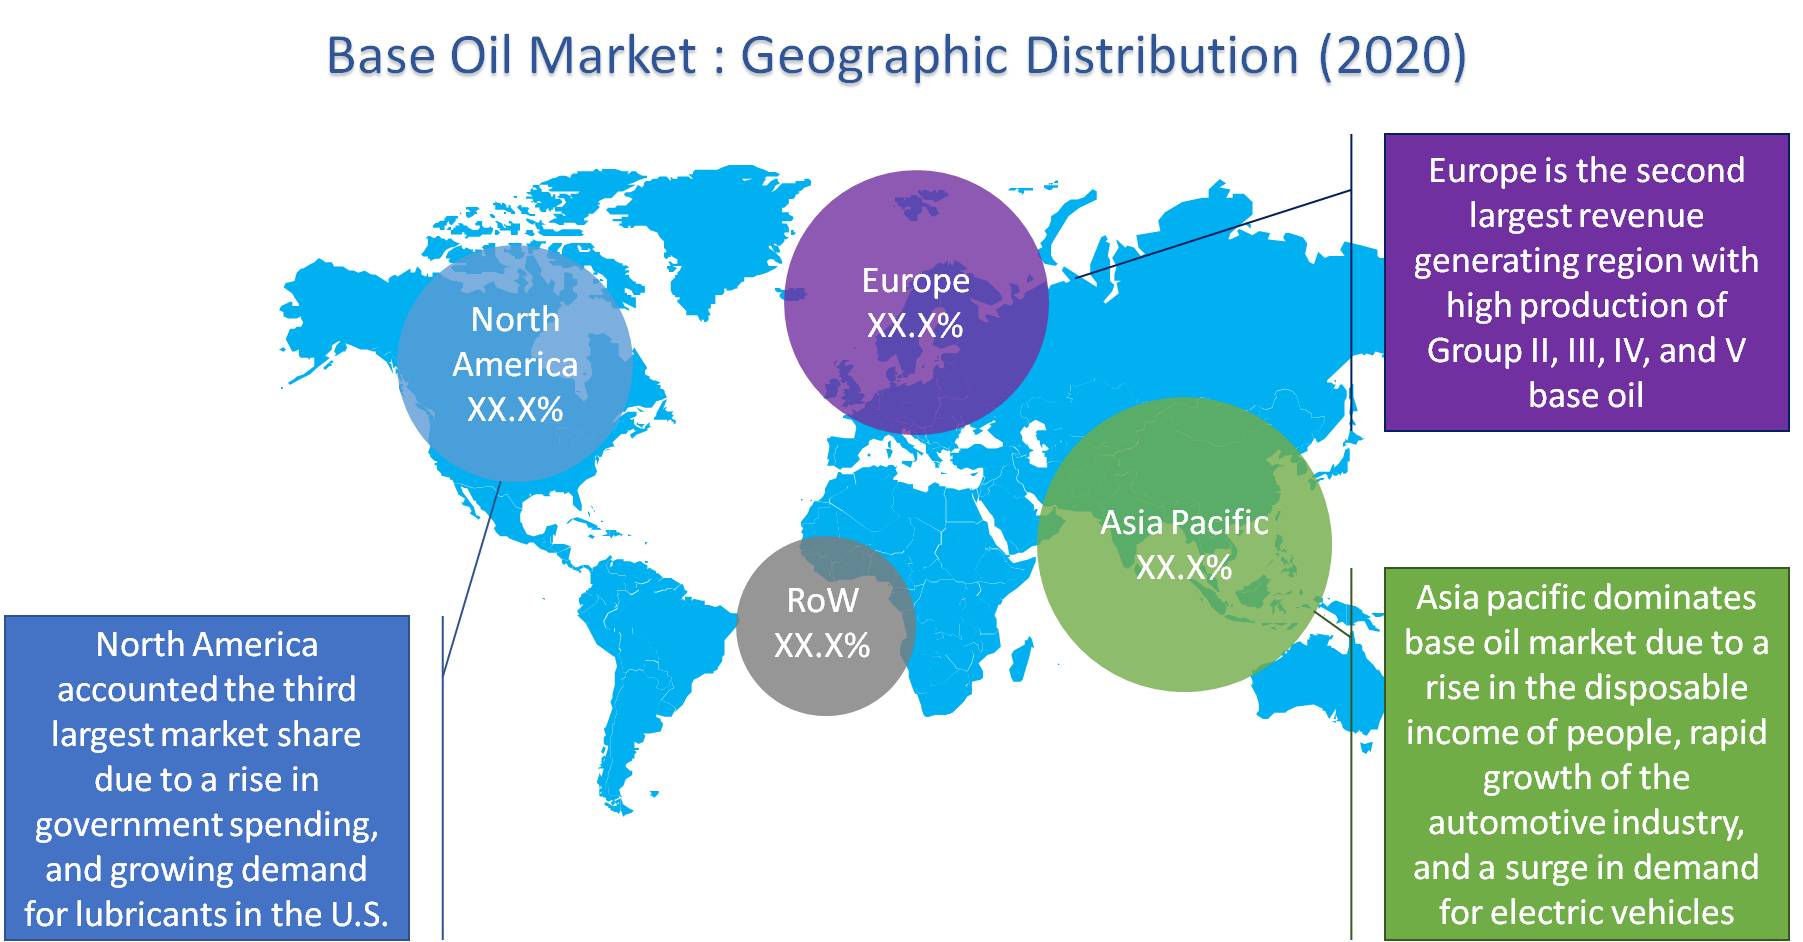
The Asia Pacific Dominates Base Oil Market
- In 2019, the Asia Pacific was the dominant region in the global base oil market. The demand for base oil is likely to increase at a significant stride during the forecast period due to a rise in the disposable income of people, the rapid growth of the automotive industry, and a surge in demand for electric vehicles in the region.
- The second-largest market oil market is Europe. Due to a rise in government spending and stringent government norms for CO2 emission. The development of making high performance lubricants using base oil is considered to surge the base oil demand in European countries.
The Key Players
Exxon Mobil Corporation, Chevron Corporation, Royal Dutch Shell plc, Calumet Specialty Products Partners, L.P., Neste Oil, AVISTA OIL AG, Nynas AB, Repsol S.A., Eegon, Inc., GS Caltex Corporation, and Hindustan Petroleum Corporation Limited, Saudi Aramco, PetroChina Company Limited, and Abu Dhabi National Oil Company are few leading players operating in the base oil market.
1. Executive Summary
2. Market Positioning
2.1. Industry Snapshot
2.1.1. Overview
2.1.2. Key Trends
2.2. Related Markets
3. Market Outlook
3.1. Overview
3.2. Value Chain
3.3. Pest Analysis
3.4. Porter Five Forces
3.5. Patent Analysis
3.6. Regulatory Framework
3.7. Pricing Analysis
4. Market Characteristics
4.1. Market Segmentation
4.2. Market Dynamics
4.2.1. Drivers
4.2.2. Restraints
4.2.3. Opportunities
4.3. DRO - Impact Analysis
5. Application: Market Size & Analysis
5.1. Overview
5.2. Automotive Oil
5.3. Industrial Oil
5.4. Hydraulic Oil
5.5. Grease
5.6. Metalworking Fluid
5.7. Others
6. Type: Market Size & Analysis
6.1. Overview
6.2. Group I
6.3. Group II
6.4. Group III
6.5. Group IV
6.6. Group V
7. Competitive Landscape
7.1. Competitor Comparison Analysis
7.2. Market Developments
7.2.1. Mergers and Acquisitions, Legal, Awards, Partnerships
7.2.2. Product Launches and execution
8. Company Profiles
8.1. Royal Dutch Shell PLC
8.1.1.1. Overview
8.1.1.2. Product Offerings
8.1.1.3. Geographic Revenue
8.1.1.4. Business Units
8.1.1.5. Developments
8.1.1.6. Business Strategy
8.2. Saudi Armaco
8.2.1.1. Overview
8.2.1.2. Product Offerings
8.2.1.3. Geographic Revenue
8.2.1.4. Business Units
8.2.1.5. Developments
8.2.1.6. Business Strategy
8.3. Neste Oil
8.3.1.1. Overview
8.3.1.2. Product Offerings
8.3.1.3. Geographic Revenue
8.3.1.4. Business Units
8.3.1.5. Developments
8.3.1.6. Business Strategy
8.4. Avista Oil AG
8.4.1.1. Overview
8.4.1.2. Product Offerings
8.4.1.3. Geographic Revenue
8.4.1.4. Business Units
8.4.1.5. Developments
8.4.1.6. Business Strategy
8.5. Nynas AB
8.5.1.1. Overview
8.5.1.2. Product Offerings
8.5.1.3. Geographic Revenue
8.5.1.4. Business Units
8.5.1.5. Developments
8.5.1.6. Business Strategy
8.6. Petronas
8.6.1.1. Overview
8.6.1.2. Product Offerings
8.6.1.3. Geographic Revenue
8.6.1.4. Business Units
8.6.1.5. Developments
8.6.1.6. Business Strategy
8.7. Repsol
8.7.1.1. Overview
8.7.1.2. Product Offerings
8.7.1.3. Geographic Revenue
8.7.1.4. Business Units
8.7.1.5. Developments
8.7.1.6. Business Strategy
8.8. Lotos Oil Sp. Z O.O
8.8.1.1. Overview
8.8.1.2. Product Offerings
8.8.1.3. Geographic Revenue
8.8.1.4. Business Units
8.8.1.5. Developments
8.8.1.6. Business Strategy
8.9. Ergon Inc.
8.9.1.1. Overview
8.9.1.2. Product Offerings
8.9.1.3. Geographic Revenue
8.9.1.4. Business Units
8.9.1.5. Developments
8.9.1.6. Business Strategy
8.10. Calumet Specialty Products Partners L.P.
8.10.1.1. Overview
8.10.1.2. Product Offerings
8.10.1.3. Geographic Revenue
8.10.1.4. Business Units
8.10.1.5. Developments
8.10.1.6. Business Strategy
9. Companies to watch
9.1. Exxon Mobil Corporation
9.1.1. Overview
9.1.2. Market
9.1.3. Business Strategy
9.2. Ergon, Inc
9.2.1. Overview
9.2.2. Market
9.2.3. Business Strategy
9.3. Total S.A.
9.3.1. Overview
9.3.2. Market
9.3.3. Business Strategy
9.4. H&R Ölwerke Schindler GmbH
9.4.1. Overview
9.4.2. Market
9.4.3. Business Strategy
9.5. Chevron Corporation
9.5.1. Overview
9.5.2. Market
9.5.3. Business Strategy
9.6. G.S. Caltex Corporation
9.6.1. Overview
9.6.2. Market
9.6.3. Business Strategy
9.7. Hindustan Petroleum Corporation Limited
9.7.1. Overview
9.7.2. Market
9.7.3. Business Strategy
9.8. Petrochina Company Limited
9.8.1. Overview
9.8.2. Market
9.8.3. Business Strategy
9.9. Abu Dhabi National Oil
9.9.1. Overview
9.9.2. Market
9.9.3. Business Strategy
9.10. SK-Pertamina
9.10.1. Overview
9.10.2. Market
9.10.3. Business Strategy
10. Analyst Opinion
11. Annexure
11.1. Report Scope
11.2. Market Definitions
11.3. Research Methodology
11.3.1. Data Collation and In-house Estimation
11.3.2. Market Triangulation
11.3.3. Forecasting
11.4. Report Assumptions
11.5. Declarations
11.6. Stakeholders
11.7. Abbreviations
TABLE 1. GLOBAL BASE OIL MARKET VALUE, BY TYPE, 2020-2026 (USD MILLION & KILOTONS)
TABLE 2. GLOBAL BASE OIL MARKET VALUE FOR GROUP I, BY GEOGRAPHY, 2020-2026 (USD MILLION & KILOTONS)
TABLE 3. GLOBAL BASE OIL MARKET VALUE FOR GROUP II, BY GEOGRAPHY, 2020-2026 (USD MILLION & KILOTONS)
TABLE 4. GLOBAL BASE OIL MARKET VALUE FOR GROUP III, BY GEOGRAPHY, 2020-2026 (USD MILLION & KILOTONS)
TABLE 5. GLOBAL BASE OIL MARKET VALUE FOR GROUP IV, BY GEOGRAPHY, 2020-2026 (USD MILLION & KILOTONS)
TABLE 6. GLOBAL BASE OIL MARKET VALUE FOR GROUP V, BY GEOGRAPHY, 2020-2026 (USD MILLION & KILOTONS)
TABLE 7. GLOBAL BASE OIL MARKET VALUE, BY APPLICATION, 2020-2026 (USD MILLION & KILOTONS)
TABLE 8. GLOBAL BASE OIL MARKET VALUE FOR AUTOMOTIVE OIL, BY GEOGRAPHY, 2020-2026 (USD MILLION & KILOTONS)
TABLE 9. GLOBAL BASE OIL MARKET VALUE FOR INDUSTRIAL OIL, BY GEOGRAPHY, 2020-2026 (USD MILLION & KILOTONS)
TABLE 10. GLOBAL BASE OIL MARKET VALUE FOR HYDRAULIC OIL, BY GEOGRAPHY, 2020-2026 (USD MILLION & KILOTONS)
TABLE 11. GLOBAL BASE OIL MARKET VALUE FOR GREASE, BY GEOGRAPHY, 2020-2026 (USD MILLION & KILOTONS)
TABLE 12. GLOBAL BASE OIL MARKET VALUE FOR METALWORKING FLUID, BY GEOGRAPHY, 2020-2026 (USD MILLION & KILOTONS)
TABLE 13. GLOBAL BASE OIL MARKET VALUE FOR OTHERS, BY GEOGRAPHY, 2020-2026 (USD MILLION & KILOTONS)
TABLE 14. NORTH AMERICA BASE OIL MARKET VALUE, BY COUNTRY, 2020-2026 (USD MILLION & KILOTONS)
TABLE 15. NORTH AMERICA BASE OIL MARKET VALUE, BY TYPE, 2020-2026 (USD MILLION & KILOTONS)
TABLE 16. NORTH AMERICA BASE OIL MARKET VALUE, BY APPLICATION, 2020-2026 (USD MILLION & KILOTONS)
TABLE 17. U.S BASE OIL MARKET VALUE, BY TYPE, 2020-2026 (USD MILLION & KILOTONS)
TABLE 18. U.S BASE OIL MARKET VALUE, BY APPLICATION, 2020-2026 (USD MILLION & KILOTONS)
TABLE 19. CANADA BASE OIL MARKET VALUE, BY TYPE, 2020-2026 (USD MILLION & KILOTONS)
TABLE 20. CANADA BASE OIL MARKET VALUE, BY APPLICATION, 2020-2026 (USD MILLION & KILOTONS)
TABLE 21. MEXICO BASE OIL MARKET VALUE, BY TYPE, 2020-2026 (USD MILLION & KILOTONS)
TABLE 22. MEXICO BASE OIL MARKET VALUE, BY APPLICATION, 2020-2026 (USD MILLION & KILOTONS)
TABLE 23. EUROPE BASE OIL MARKET VALUE, BY COUNTRY, 2020-2026 (USD MILLION & KILOTONS)
TABLE 24. EUROPE BASE OIL MARKET VALUE, BY TYPE, 2020-2026 (USD MILLION & KILOTONS)
TABLE 25. EUROPE BASE OIL MARKET VALUE, BY APPLICATION, 2020-2026 (USD MILLION & KILOTONS)
TABLE 26. GERMANY BASE OIL MARKET VALUE, BY TYPE, 2020-2026 (USD MILLION & KILOTONS)
TABLE 27. GERMANY BASE OIL MARKET VALUE, BY APPLICATION, 2020-2026 (USD MILLION & KILOTONS)
TABLE 28. THE U.K. BASE OIL MARKET VALUE, BY TYPE, 2020-2026 (USD MILLION & KILOTONS)
TABLE 29. THE U.K. BASE OIL MARKET VALUE, BY APPLICATION, 2020-2026 (USD MILLION & KILOTONS)
TABLE 30. RUSSIA BASE OIL MARKET VALUE, BY TYPE, 2020-2026 (USD MILLION & KILOTONS)
TABLE 31. RUSSIA BASE OIL MARKET VALUE, BY APPLICATION, 2020-2026 (USD MILLION & KILOTONS)
TABLE 32. FRANCE BASE OIL MARKET VALUE, BY TYPE, 2020-2026 (USD MILLION & KILOTONS)
TABLE 33. FRANCE BASE OIL MARKET VALUE, BY APPLICATION, 2020-2026 (USD MILLION & KILOTONS)
TABLE 34. ROE BASE OIL MARKET VALUE, BY TYPE, 2020-2026 (USD MILLION & KILOTONS)
TABLE 35. ROE BASE OIL MARKET VALUE, BY APPLICATION, 2020-2026 (USD MILLION & KILOTONS)
TABLE 36. ASIA PACIFIC BASE OIL MARKET VALUE, BY COUNTRY, 2020-2026 (USD MILLION & KILOTONS)
TABLE 37. ASIA PACIFIC BASE OIL MARKET VALUE, BY TYPE, 2020-2026 (USD MILLION & KILOTONS)
TABLE 38. ASIA PACIFIC BASE OIL MARKET VALUE, BY APPLICATION, 2020-2026 (USD MILLION & KILOTONS)
TABLE 39. CHINA BASE OIL MARKET VALUE, BY TYPE, 2020-2026 (USD MILLION & KILOTONS)
TABLE 40. CHINA BASE OIL MARKET VALUE, BY APPLICATION, 2020-2026 (USD MILLION & KILOTONS)
TABLE 41. JAPAN BASE OIL MARKET VALUE, BY TYPE, 2020-2026 (USD MILLION & KILOTONS)
TABLE 42. JAPAN BASE OIL MARKET VALUE, BY APPLICATION, 2020-2026 (USD MILLION & KILOTONS)
TABLE 43. INDIA BASE OIL MARKET VALUE, BY TYPE, 2020-2026 (USD MILLION & KILOTONS)
TABLE 44. INDIA BASE OIL MARKET VALUE, BY APPLICATION, 2020-2026 (USD MILLION & KILOTONS)
TABLE 45. INDONESIA BASE OIL MARKET VALUE, BY TYPE, 2020-2026 (USD MILLION & KILOTONS)
TABLE 46. INDONESIA BASE OIL MARKET VALUE, BY APPLICATION, 2020-2026 (USD MILLION & KILOTONS)
TABLE 47. REST OF ASIA PACIFIC BASE OIL MARKET VALUE, BY TYPE, 2020-2026 (USD MILLION & KILOTONS)
TABLE 48. REST OF ASIA PACIFIC BASE OIL MARKET VALUE, BY APPLICATION, 2020-2026 (USD MILLION & KILOTONS)
TABLE 49. REST OF WORLD BASE OIL MARKET VALUE, BY COUNTRY, 2020-2026 (USD MILLION & KILOTONS)
TABLE 50. REST OF WORLD BASE OIL MARKET VALUE, BY TYPE, 2020-2026 (USD MILLION & KILOTONS)
TABLE 51. REST OF WORLD BASE OIL MARKET VALUE, BY APPLICATION, 2020-2026 (USD MILLION & KILOTONS)
TABLE 52. MIDDLE EAST BASE OIL MARKET VALUE, BY TYPE, 2020-2026 (USD MILLION & KILOTONS)
TABLE 53. MIDDLE EAST BASE OIL MARKET VALUE, BY APPLICATION, 2020-2026 (USD MILLION & KILOTONS)
TABLE 54. BRAZIL BASE OIL MARKET VALUE, BY TYPE, 2020-2026 (USD MILLION & KILOTONS)
TABLE 55. BRAZIL BASE OIL MARKET VALUE, BY APPLICATION, 2020-2026 (USD MILLION & KILOTONS)
TABLE 56. ARGENTINA BASE OIL MARKET VALUE, BY TYPE, 2020-2026 (USD MILLION & KILOTONS)
TABLE 57. ARGENTINA BASE OIL MARKET VALUE, BY APPLICATION, 2020-2026 (USD MILLION & KILOTONS)
TABLE 58. OTHER COUNTRIES BASE OIL MARKET VALUE, BY TYPE, 2020-2026 (USD MILLION & KILOTONS)
TABLE 59. OTHER COUNTRIES BASE OIL MARKET VALUE, BY APPLICATION, 2020-2026 (USD MILLION & KILOTONS)
TABLE 60. ROYAL DUTCH SHELL PLC.: OVERVIEW
TABLE 61. ROYAL DUTCH SHELL PLC.: STRATEGIC SNAPSHOT
TABLE 62. ROYAL DUTCH SHELL PLC.: BUSINESS OPPORTUNITIES AND OUTLOOK
TABLE 63. ROYAL DUTCH SHELL PLC.: PRODUCT/SERVICE PORTFOLIO
TABLE 64. CHEVRON CORPORATION: OVERVIEW
TABLE 65. CHEVRON CORPORATION: STRATEGIC SNAPSHOT
TABLE 66. CHEVRON CORPORATION: BUSINESS OPPORTUNITIES AND OUTLOOK
TABLE 67. CHEVRON CORPORATION: PRODUCT/SERVICE PORTFOLIO
TABLE 68. NESTE OIL: OVERVIEW
TABLE 69. NESTE OIL: STRATEGIC SNAPSHOT
TABLE 70. NESTE OIL: BUSINESS OPPORTUNITIES AND OUTLOOK
TABLE 71. NESTE OIL: PRODUCT/SERVICE PORTFOLIO
TABLE 72. AVISTA OIL AG.: OVERVIEW
TABLE 73. AVISTA OIL AG.: STRATEGIC SNAPSHOT
TABLE 74. AVISTA OIL AG.: BUSINESS OPPORTUNITIES AND OUTLOOK
TABLE 75. AVISTA OIL AG.: PRODUCT/SERVICE PORTFOLIO
TABLE 76. NYNAS AB: OVERVIEW
TABLE 77. NYNAS AB: STRATEGIC SNAPSHOT
TABLE 78. NYNAS AB: BUSINESS OPPORTUNITIES AND OUTLOOK
TABLE 79. NYNAS AB: PRODUCT/SERVICE PORTFOLIO
TABLE 80. PETRONAS.: OVERVIEW
TABLE 81. PETRONAS.: STRATEGIC SNAPSHOT
TABLE 82. PETRONAS.: BUSINESS OPPORTUNITIES AND OUTLOOK
TABLE 83. PETRONAS.: PRODUCT/SERVICE PORTFOLIO
TABLE 84. REPSOL: OVERVIEW
TABLE 85. REPSOL: STRATEGIC SNAPSHOT
TABLE 86. REPSOL: BUSINESS OPPORTUNITIES AND OUTLOOK
TABLE 87. REPSOL: PRODUCT/SERVICE PORTFOLIO
TABLE 88. LOTOS OIL SP. Z O.O..: OVERVIEW
TABLE 89. LOTOS OIL SP. Z O.O..: STRATEGIC SNAPSHOT
TABLE 90. LOTOS OIL SP. Z O.O..: BUSINESS OPPORTUNITIES AND OUTLOOK
TABLE 91. LOTOS OIL SP. Z O.O..: PRODUCT/SERVICE PORTFOLIO
TABLE 92. ERGON INC.: OVERVIEW
TABLE 93. ERGON INC.: STRATEGIC SNAPSHOT
TABLE 94. ERGON INC.: BUSINESS OPPORTUNITIES AND OUTLOOK
TABLE 95. ERGON INC.: PRODUCT/SERVICE PORTFOLIO
TABLE 96. CALUMET SPECIALTY PRODUCTS PARTNERS LP.: OVERVIEW
TABLE 97. CALUMET SPECIALTY PRODUCTS PARTNERS LP.: STRATEGIC SNAPSHOT
TABLE 98. CALUMET SPECIALTY PRODUCTS PARTNERS LP.: BUSINESS OPPORTUNITIES AND OUTLO
TABLE 99. CALUMET SPECIALTY PRODUCTS PARTNERS LP.: PRODUCT/SERVICE PORTFOLIO
Research Framework
Infoholic Research works on a holistic 360° approach in order to deliver high quality, validated and reliable information in our market reports. The Market estimation and forecasting involves following steps:
- Data Collation (Primary & Secondary)
- In-house Estimation (Based on proprietary data bases and Models)
- Market Triangulation
- Forecasting

Market related information is congregated from both primary and secondary sources.
Primary sources
Involved participants from all global stakeholders such as Solution providers, service providers, Industry associations, thought leaders etc. across levels such as CXOs, VPs and managers. Plus, our in-house industry experts having decades of industry experience contribute their consulting and advisory services.
Secondary sources
Include public sources such as regulatory frameworks, government IT spending, government demographic indicators, industry association statistics, and company publications along with paid sources such as Factiva, OneSource, Bloomberg among others.
![]()


