
Barrier Systems Market by Type (Bollards, Crash Barrier Systems, Drop Arms, Fences and Others), Function (Active and Passive), Access Control Device (Biometric Systems, Perimeter Security Systems & Alarms, Token & Reader Technology, Turnstile, and Others), End-use (Commercial, Data Centers, Financial Institutions, Government, Industrial, Petrochemical, Military & Defense, Transportation, and Others) and Geography – Global Forecast up to 2026
- May, 2021
- Domain: Electronics & Semiconductors - Electronics & Semiconductors
- Get Free 10% Customization in this Report
Barrier systems are vital components that ensure safety solutions on commercial buildings, airports, residential lanes, roadways, railways, etc. They are installed to manage vehicles efficiently and to reduce the chances of vehicle intrusions. The barrier systems are also installed in commercial infrastructures such as commercial and institutional buildings, complexes, and residential areas. The barrier systems market growth can be ascribed to the drastically growing construction and automotive industries, leading to a growth in the demand for various safety solutions such as crash barrier systems, fences, and gates. The expansion of commercial real estate-related to an adaptation of transport infrastructure across the globe dramatically influences the barrier systems market growth over the forecast period. Besides that, the huge cost due to the barrier collision and the encroachment of highway agencies will restrict the growth of the barrier systems market. The Barrier Systems Market is predicted to grow at the rate of 9.84% CAGR by 2026.
Research Methodology:
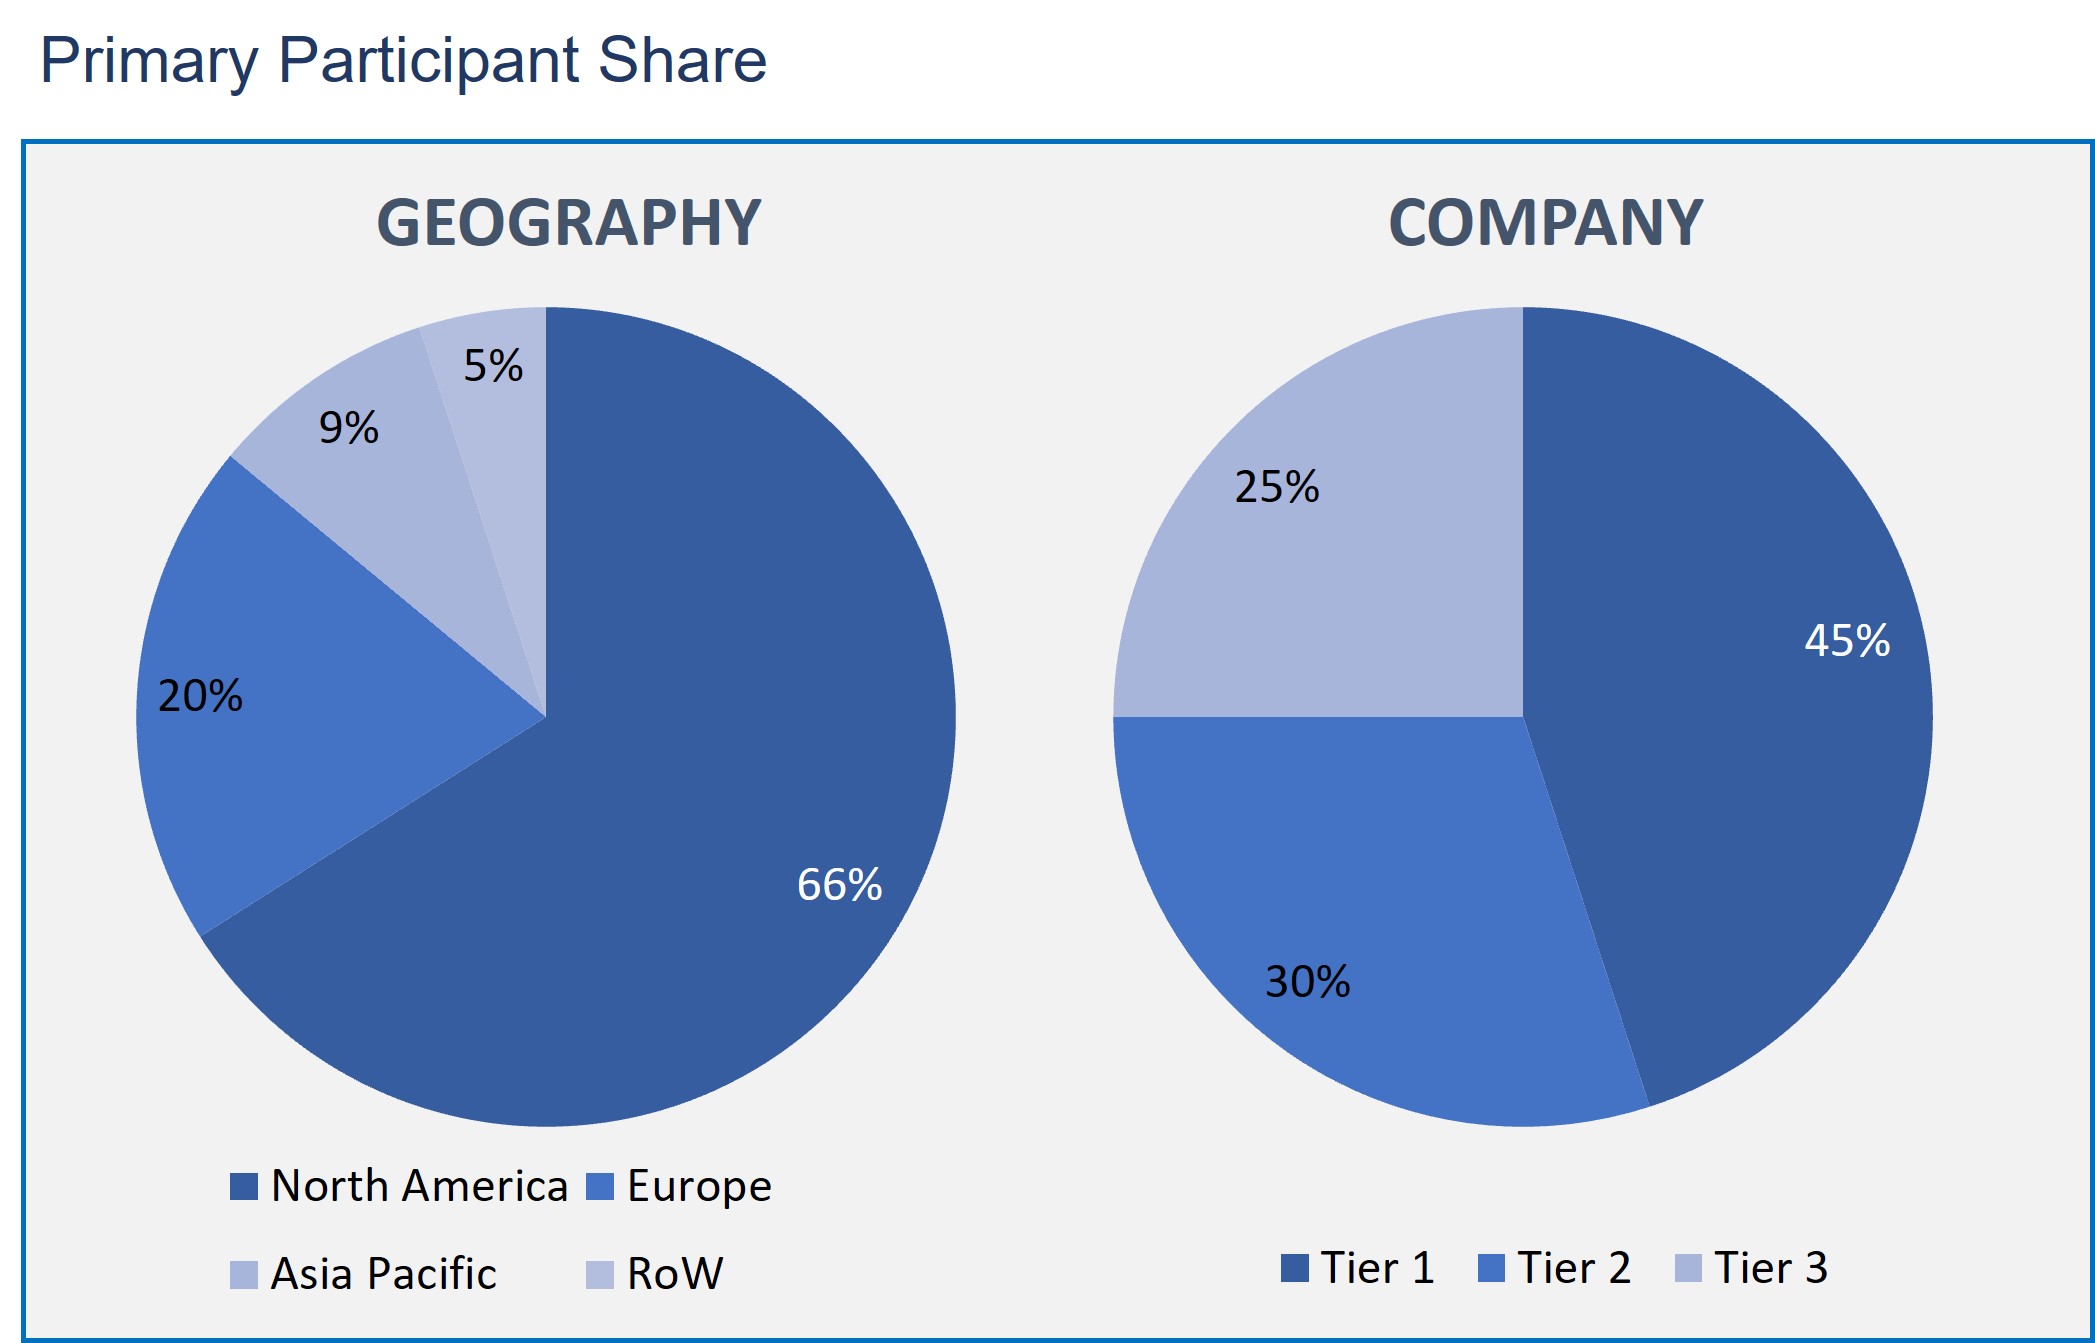
The barrier systems market has been analyzed by utilizing the optimum combination of secondary sources and in-house methodology and a unique balance of primary insights. The real-time valuation of the market is an integral part of our forecasting and market sizing methodology. Industry experts and our primary participants have helped to compile related aspects with accurate parametric estimations for a complete study. The primary participants share is given below:
Barrier Systems Market based on Type
- Bollards
- Crash Barrier Systems
- Drop Arms
- Fences
- Others
Barrier Systems Market based on Function
- Active
- Passive
Barrier Systems Market based on Access Control Device
- Biometric Systems
- Perimeter Security Systems & Alarms
- Token & Reader Technology
- Turnstile
- Others
Barrier Systems Market based on End-use
- Commercial
- Data Centers
- Financial Institutions
- Government
- Industrial
- Petrochemical
- Military & Defense
- Transportation
- Others
Barrier Systems Market based on Geography
- North America
- Europe
- Asia Pacific
- Rest of the World
In the market based on type, the crash barrier system segment has a significant share in the barrier systems market. This is because the rising installment of these systems through highways reduces the effect of vehicles at high speed and avoids accidents and fatalities. Most importantly, these systems require minimal maintenance costs compared to other barrier systems.
As per the function segmentation, the passive function has a maximum portion of the barrier system market share. This is due to the increasing usage of these barriers in commercial and residential building construction areas. They prevent vehicle intrusion in the construction areas to protect buildings. Passive barriers are primarily installed in end-use industries due to their uncomplicated and easy-to-operate capabilities.
If analyzed market by the access control device, the token and reader technology is predicted to account for the highest share of the barrier systems market. This technology is most widely used by civil disaster administrators, emergency response personnel, and law enforcement agencies incorporated in the access control panels. This technology also helps track the access control system activity, facility configuration, and user permissions.
The military and defense end-users play a primary role in the barrier systems market share. The primary role is attributed to the rising deployment of these systems to protect infrastructural and personnel in the military, security, and environmental applications. Moreover, various vendors are focusing on manufacturing systems with versatile and modular configurations.
North America is witnessing a substantial share in the barrier systems market. The terrorist activities in this region are the primary reason for the wide adoption of the barrier system in the military and defense industry to enhance security and safeguard the citizens from war threats.
High investments in railways, roadways, and airport constructions around the world may create the requirement to deploy safety barrier systems. Roadway construction, such as highways and flyovers, needs crash barrier systems to minimize road accidents. The growth of the airport network is anticipated to generate the need for bollards in the entrance and exit, security checkpoints, passenger queues, drop arms in the vehicle parking areas, and vehicle entrance. Thus, the aspects mentioned above are driving the market growth.
This report provides the profiles of the major competitors of market-Delta Scientific Corporation, Hill & Smith Holdings PLC, Gramm Barrier Systems Limited, Valmont Structures Pvt. Ltd, FutureNet Group Inc., Automatic Systems, Avon Barrier Corporation Ltd, Lindsay Corporation, Tata Steel Limited, Trinity Industries Inc., and Barrier1 Systems Inc.
Hence, the barrier systems have a prominent role in the expanding building and construction sector since these barriers are more efficient in protecting the buildings. Moreover, the increasing incidence of accidents is minimized with the help of crash barrier systems.
- The report provides a complete perception of the market growth factors and other factors that positively and negatively influence market growth.
- This study defines every segment and sub-segment and their share in the market growth.
- Further, this report offers an analysis of the imminent trends and preferences of consumers.
- In-depth analyses are given about the key competitors of the market in response to their dynamic strategies, new product launches, and expansion of the business.
- Executive Summary
- Industry Outlook
- Industry Overview
- Industry Trends
- Market Snapshot
- Market Definition
- Market Outlook
- Porter Five Forces
- Related Markets
- Market characteristics
- Market Overview
- Market Segmentation
- Market Dynamics
- Drivers
- Restraints
- Opportunities
- DRO - Impact Analysis
- Type: Market Size & Analysis
- Overview
- Bollards
- Crash Barrier Systems
- Drop Arms
- Fences
- Others
- Function: Market Size & Analysis
- Overview
- Active
- Passive
- Access Control Device: Market Size & Analysis
- Overview
- Biometric Systems
- Perimeter Security Systems & Alarms
- Token & Reader Technology
- Turnstile
- Others
- End-use: Market Size & Analysis
- Overview
- Commercial
- Data Centers
- Financial Institutions
- Government
- Industrial
- Petrochemical
- Military & Defense
- Transportation
- Others
- Geography: Market Size & Analysis
- Overview
- North America
- Europe
- Asia Pacific
- Rest of the World
- Competitive Landscape
- Competitor Comparison Analysis
- Market Developments
- Mergers and Acquisitions, Legal, Awards, Partnerships
- Product Launches and execution
- Vendor Profiles
- Delta Scientific Corporation
- Overview
- Financial Overview
- Product Offerings
- Developments
- Business Strategy
- Hill & Smith Holdings PLC
- Overview
- Financial Overview
- Product Offerings
- Developments
- Business Strategy
- Gramm Barrier Systems Limited
- Overview
- Financial Overview
- Product Offerings
- Developments
- Business Strategy
- Valmont Structures Pvt. Ltd
- Overview
- Financial Overview
- Product Offerings
- Developments
- Business Strategy
- FutureNet Group Inc.
- Overview
- Financial Overview
- Product Offerings
- Developments
- Business Strategy
- Automatic Systems
- Overview
- Financial Overview
- Product Offerings
- Developments
- Business Strategy
- Avon Barrier Corporation Ltd
- Overview
- Financial Overview
- Product Offerings
- Developments
- Business Strategy
- Lindsay Corporation
- Overview
- Financial Overview
- Product Offerings
- Developments
- Business Strategy
- Tata Steel Limited
- Overview
- Financial Overview
- Product Offerings
- Developments
- Business Strategy
- Trinity Industries Inc.
- Overview
- Financial Overview
- Product Offerings
- Developments
- Business Strategy
- Delta Scientific Corporation
- Companies to Watch
- Barrier1 Systems Inc.
- Overview
- Products & Services
- Business Strategy
- Barrier1 Systems Inc.
- Analyst Opinion
- Annexure
- Report Scope
- Market Definitions
- Research Methodology
- Data Collation and In-house Estimation
- Market Triangulation
- Forecasting
- Report Assumptions
- Declarations
- Stakeholders
- Abbreviations
TABLE 1. GLOBAL BARRIER SYSTEMS MARKET VALUE, BY TYPE, 2020-2026 (USD BILLION)
TABLE 2. GLOBAL BARRIER SYSTEMS MARKET VALUE FOR BOLLARDS, BY GEOGRAPHY, 2020-2026 (USD BILLION)
TABLE 3. GLOBAL BARRIER SYSTEMS MARKET VALUE FOR CRASH BARRIER SYSTEMS, BY GEOGRAPHY, 2020-2026 (USD BILLION)
TABLE 4. GLOBAL BARRIER SYSTEMS MARKET VALUE FOR DROP ARMS, BY GEOGRAPHY, 2020-2026 (USD BILLION)
TABLE 5. GLOBAL BARRIER SYSTEMS MARKET VALUE FOR FENCES, BY GEOGRAPHY, 2020-2026 (USD BILLION)
TABLE 6. GLOBAL BARRIER SYSTEMS MARKET VALUE FOR OTHERS, BY GEOGRAPHY, 2020-2026 (USD BILLION)
TABLE 7. GLOBAL BARRIER SYSTEMS MARKET VALUE, BY FUNCTION, 2020-2026 (USD BILLION)
TABLE 8. GLOBAL BARRIER SYSTEMS MARKET VALUE FOR ACTIVE, BY GEOGRAPHY, 2020-2026 (USD BILLION)
TABLE 9. GLOBAL BARRIER SYSTEMS MARKET VALUE FOR PASSIVE, BY GEOGRAPHY, 2020-2026 (USD BILLION)
TABLE 10. GLOBAL BARRIER SYSTEMS MARKET VALUE, BY ACCESS CONTROL DEVICE, 2020-2026 (USD BILLION)
TABLE 11. GLOBAL BARRIER SYSTEMS MARKET VALUE FOR BIOMETRIC SYSTEMS, 2020-2026 (USD BILLION)
TABLE 12. GLOBAL BARRIER SYSTEMS MARKET VALUE FOR PERIMETER SECURITY SYSTEMS & ALARMS, BY GEOGRAPHY, 2020-2026 (USD BILLION)
TABLE 13. GLOBAL BARRIER SYSTEMS MARKET VALUE FOR TOKEN & READER TECHNOLOGY, BY GEOGRAPHY, 2020-2026 (USD BILLION)
TABLE 14. GLOBAL BARRIER SYSTEMS MARKET VALUE FOR TURNSTILE, BY GEOGRAPHY, 2020-2026 (USD BILLION)
TABLE 15. GLOBAL BARRIER SYSTEMS MARKET VALUE FOR OTHERS, BY GEOGRAPHY, 2020-2026 (USD BILLION)
TABLE 16. GLOBAL BARRIER SYSTEMS MARKET VALUE, END-USE, 2020-2026 (USD BILLION)
TABLE 17. GLOBAL BARRIER SYSTEMS MARKET VALUE FOR COMMERCIAL, BY GEOGRAPHY, 2020-2026 (USD BILLION)
TABLE 18. GLOBAL BARRIER SYSTEMS MARKET VALUE FOR DATA CENTERS, BY GEOGRAPHY, 2020-2026 (USD BILLION)
TABLE 19. GLOBAL BARRIER SYSTEMS MARKET VALUE FOR FINANCIAL INSTITUTIONS, BY GEOGRAPHY, 2020-2026 (USD BILLION)
TABLE 20. GLOBAL BARRIER SYSTEMS MARKET VALUE FOR GOVERNMENT, BY GEOGRAPHY, 2020-2026 (USD BILLION)
TABLE 21. GLOBAL BARRIER SYSTEMS MARKET VALUE FOR INDUSTRIAL, BY GEOGRAPHY, 2020-2026 (USD BILLION)
TABLE 22. GLOBAL BARRIER SYSTEMS MARKET VALUE FOR PETROCHEMICAL, BY GEOGRAPHY, 2020-2026 (USD BILLION)
TABLE 23. GLOBAL BARRIER SYSTEMS MARKET VALUE FOR MILITARY & DEFENSE, BY GEOGRAPHY, 2020-2026 (USD BILLION)
TABLE 24. GLOBAL BARRIER SYSTEMS MARKET VALUE FOR TRANSPORTATION, BY GEOGRAPHY, 2020-2026 (USD BILLION)
TABLE 25. GLOBAL BARRIER SYSTEMS MARKET VALUE FOR OTHERS, BY GEOGRAPHY, 2020-2026 (USD BILLION)
TABLE 26. NORTH AMERICA BARRIER SYSTEMS MARKET VALUE, BY COUNTRY, 2020-2026 (USD BILLION)
TABLE 27. NORTH AMERICA BARRIER SYSTEMS MARKET VALUE, BY TYPE, 2020-2026 (USD BILLION)
TABLE 28. NORTH AMERICA BARRIER SYSTEMS MARKET VALUE, BY FUNCTION, 2020-2026 (USD BILLION)
TABLE 29. NORTH AMERICA BARRIER SYSTEMS MARKET VALUE, BY ACCESS CONTROL DEVICE, 2020-2026 (USD BILLION)
TABLE 30. NORTH AMERICA BARRIER SYSTEMS MARKET VALUE, BY END-USE, 2020-2026 (USD BILLION)
TABLE 31. U.S BARRIER SYSTEMS MARKET VALUE, BY TYPE, 2020-2026 (USD BILLION)
TABLE 32. U.S BARRIER SYSTEMS MARKET VALUE, BY FUNCTION, 2020-2026 (USD BILLION)
TABLE 33. U.S BARRIER SYSTEMS MARKET VALUE, BY ACCESS CONTROL DEVICE, 2020-2026 (USD BILLION)
TABLE 34. U.S BARRIER SYSTEMS MARKET VALUE, BY END-USE, 2020-2026 (USD BILLION)
TABLE 35. CANADA BARRIER SYSTEMS MARKET VALUE, BY TYPE, 2020-2026 (USD BILLION)
TABLE 36. CANADA BARRIER SYSTEMS MARKET VALUE, BY FUNCTION, 2020-2026 (USD BILLION)
TABLE 37. CANADA BARRIER SYSTEMS MARKET VALUE, BY ACCESS CONTROL DEVICE, 2020-2026 (USD BILLION)
TABLE 38. CANADA BARRIER SYSTEMS MARKET VALUE, BY END-USE, 2020-2026 (USD BILLION)
TABLE 39. EUROPE BARRIER SYSTEMS MARKET VALUE, BY COUNTRY, 2020-2026 (USD BILLION)
TABLE 40. EUROPE BARRIER SYSTEMS MARKET VALUE, BY TYPE, 2020-2026 (USD BILLION)
TABLE 41. EUROPE BARRIER SYSTEMS MARKET VALUE, BY FUNCTION, 2020-2026 (USD BILLION)
TABLE 42. EUROPE BARRIER SYSTEMS MARKET VALUE, BY ACCESS CONTROL DEVICE, 2020-2026 (USD BILLION)
TABLE 43. EUROPE BARRIER SYSTEMS MARKET VALUE, BY END-USE, 2020-2026 (USD BILLION)
TABLE 44. GERMANY BARRIER SYSTEMS MARKET VALUE, BY TYPE, 2020-2026 (USD BILLION)
TABLE 45. GERMANY BARRIER SYSTEMS MARKET VALUE, BY FUNCTION, 2020-2026 (USD BILLION)
TABLE 46. GERMANY BARRIER SYSTEMS MARKET VALUE, BY ACCESS CONTROL DEVICE, 2020-2026 (USD BILLION)
TABLE 47. GERMANY BARRIER SYSTEMS MARKET VALUE, BY END-USE, 2020-2026 (USD BILLION)
TABLE 48. U.K BARRIER SYSTEMS MARKET VALUE, BY TYPE, 2020-2026 (USD BILLION)
TABLE 49. U.K BARRIER SYSTEMS MARKET VALUE, BY FUNCTION, 2020-2026 (USD BILLION)
TABLE 50. U.K BARRIER SYSTEMS MARKET VALUE, BY ACCESS CONTROL DEVICE, 2020-2026 (USD BILLION)
TABLE 51. U.K BARRIER SYSTEMS MARKET VALUE, BY END-USE, 2020-2026 (USD BILLION)
TABLE 52. FRANCE BARRIER SYSTEMS MARKET VALUE, BY TYPE, 2020-2026 (USD BILLION)
TABLE 53. FRANCE BARRIER SYSTEMS MARKET VALUE, BY FUNCTION, 2020-2026 (USD BILLION)
TABLE 54. FRANCE BARRIER SYSTEMS MARKET VALUE, BY ACCESS CONTROL DEVICE, 2020-2026 (USD BILLION)
TABLE 55. FRANCE BARRIER SYSTEMS MARKET VALUE, BY END-USE, 2020-2026 (USD BILLION)
TABLE 56. ITALY BARRIER SYSTEMS MARKET VALUE, BY TYPE, 2020-2026 (USD BILLION)
TABLE 57. ITALY BARRIER SYSTEMS MARKET VALUE, BY FUNCTION, 2020-2026 (USD BILLION)
TABLE 58. ITALY BARRIER SYSTEMS MARKET VALUE, BY ACCESS CONTROL DEVICE, 2020-2026 (USD BILLION)
TABLE 59. ITALY BARRIER SYSTEMS MARKET VALUE, BY END-USE, 2020-2026 (USD BILLION)
TABLE 60. SPAIN BARRIER SYSTEMS MARKET VALUE, BY TYPE, 2020-2026 (USD BILLION)
TABLE 61. SPAIN BARRIER SYSTEMS MARKET VALUE, BY FUNCTION, 2020-2026 (USD BILLION)
TABLE 62. SPAIN BARRIER SYSTEMS MARKET VALUE, BY ACCESS CONTROL DEVICE, 2020-2026 (USD BILLION)
TABLE 63. SPAIN BARRIER SYSTEMS MARKET VALUE, BY END-USE, 2020-2026 (USD BILLION)
TABLE 64. ROE BARRIER SYSTEMS MARKET VALUE, BY TYPE, 2020-2026 (USD BILLION)
TABLE 65. ROE BARRIER SYSTEMS MARKET VALUE, BY FUNCTION, 2020-2026 (USD BILLION)
TABLE 66. ROE BARRIER SYSTEMS MARKET VALUE, BY ACCESS CONTROL DEVICE, 2020-2026 (USD BILLION)
TABLE 67. ROE BARRIER SYSTEMS MARKET VALUE, BY END-USE, 2020-2026 (USD BILLION)
TABLE 68. ASIA PACIFIC BARRIER SYSTEMS MARKET VALUE, BY COUNTRY, 2020-2026 (USD BILLION)
TABLE 69. ASIA PACIFIC BARRIER SYSTEMS MARKET VALUE, BY TYPE, 2020-2026 (USD BILLION)
TABLE 70. ASIA PACIFIC BARRIER SYSTEMS MARKET VALUE, BY FUNCTION, 2020-2026 (USD BILLION)
TABLE 71. ASIA PACIFIC BARRIER SYSTEMS MARKET VALUE, BY ACCESS CONTROL DEVICE, 2020-2026 (USD BILLION)
TABLE 72. ASIA PACIFIC BARRIER SYSTEMS MARKET VALUE, BY END-USE, 2020-2026 (USD BILLION)
TABLE 73. CHINA BARRIER SYSTEMS MARKET VALUE, BY TYPE, 2020-2026 (USD BILLION)
TABLE 74. CHINA BARRIER SYSTEMS MARKET VALUE, BY FUNCTION, 2020-2026 (USD BILLION)
TABLE 75. CHINA BARRIER SYSTEMS MARKET VALUE, BY ACCESS CONTROL DEVICE, 2020-2026 (USD BILLION)
TABLE 76. CHINA BARRIER SYSTEMS MARKET VALUE, BY END-USE, 2020-2026 (USD BILLION)
TABLE 77. INDIA BARRIER SYSTEMS MARKET VALUE, BY TYPE, 2020-2026 (USD BILLION)
TABLE 78. INDIA BARRIER SYSTEMS MARKET VALUE, BY FUNCTION, 2020-2026 (USD BILLION)
TABLE 79. INDIA BARRIER SYSTEMS MARKET VALUE, BY ACCESS CONTROL DEVICE, 2020-2026 (USD BILLION)
TABLE 80. INDIA BARRIER SYSTEMS MARKET VALUE, BY END-USE, 2020-2026 (USD BILLION)
TABLE 81. JAPAN BARRIER SYSTEMS MARKET VALUE, BY TYPE, 2020-2026 (USD BILLION)
TABLE 82. JAPAN BARRIER SYSTEMS MARKET VALUE, BY FUNCTION, 2020-2026 (USD BILLION)
TABLE 83. JAPAN BARRIER SYSTEMS MARKET VALUE, BY ACCESS CONTROL DEVICE, 2020-2026 (USD BILLION)
TABLE 84. JAPAN BARRIER SYSTEMS MARKET VALUE, BY END-USE, 2020-2026 (USD BILLION)
TABLE 85. REST OF APAC BARRIER SYSTEMS MARKET VALUE, BY TYPE, 2020-2026 (USD BILLION)
TABLE 86. REST OF APAC BARRIER SYSTEMS MARKET VALUE, BY FUNCTION, 2020-2026 (USD BILLION)
TABLE 87. REST OF APAC BARRIER SYSTEMS MARKET VALUE, BY ACCESS CONTROL DEVICE, 2020-2026 (USD BILLION)
TABLE 88. REST OF APAC BARRIER SYSTEMS MARKET VALUE, BY END-USE, 2020-2026 (USD BILLION)
TABLE 89. REST OF WORLD BARRIER SYSTEMS MARKET VALUE, BY TYPE, 2020-2026 (USD BILLION)
TABLE 90. REST OF WORLD BARRIER SYSTEMS MARKET VALUE, BY FUNCTION, 2020-2026 (USD BILLION)
TABLE 91. REST OF WORLD BARRIER SYSTEMS MARKET VALUE, BY ACCESS CONTROL DEVICE, 2020-2026 (USD BILLION)
TABLE 92. REST OF WORLD BARRIER SYSTEMS MARKET VALUE, BY END-USE, 2020-2026 (USD BILLION)
TABLE 93. DELTA SCIENTIFIC CORPORATION: FINANCIALS
TABLE 94. DELTA SCIENTIFIC CORPORATION: PRODUCT AND SERVICES
TABLE 95. DELTA SCIENTIFIC CORPORATION: RECENT DEVELOPMENTS
TABLE 96. HILL & SMITH HOLDINGS PLC: FINANCIALS
TABLE 97. HILL & SMITH HOLDINGS PLC: PRODUCT AND SERVICES
TABLE 98. HILL & SMITH HOLDINGS PLC: RECENT DEVELOPMENTS
TABLE 99. GRAMM BARRIER SYSTEMS LIMITED: FINANCIALS
TABLE 100. GRAMM BARRIER SYSTEMS LIMITED: PRODUCT AND SERVICES
TABLE 101. GRAMM BARRIER SYSTEMS LIMITED: RECENT DEVELOPMENTS
TABLE 102. VALMONT STRUCTURES PVT. LTD: FINANCIALS
TABLE 103. VALMONT STRUCTURES PVT. LTD: PRODUCT AND SERVICES
TABLE 104. VALMONT STRUCTURES PVT. LTD: RECENT DEVELOPMENTS
TABLE 105. FUTURENET GROUP INC: FINANCIALS
TABLE 106. FUTURENET GROUP INC: PRODUCT AND SERVICES
TABLE 107. FUTURENET GROUP INC: RECENT DEVELOPMENTS
TABLE 108. AUTOMATIC SYSTEMS: FINANCIALS
TABLE 109. AUTOMATIC SYSTEMS: PRODUCT AND SERVICES
TABLE 110. AUTOMATIC SYSTEMS: RECENT DEVELOPMENTS
TABLE 111. AVON BARRIER CORPORATION LTD: FINANCIALS
TABLE 112. AVON BARRIER CORPORATION LTD: PRODUCT AND SERVICES
TABLE 113. AVON BARRIER CORPORATION LTD: RECENT DEVELOPMENTS
TABLE 114. LINDSAY CORPORATION: FINANCIALS
TABLE 115. LINDSAY CORPORATION: PRODUCT AND SERVICES
TABLE 116. LINDSAY CORPORATION: RECENT DEVELOPMENTS
TABLE 117. TATA STEEL LIMITED: FINANCIALS
TABLE 118. TATA STEEL LIMITED: PRODUCT AND SERVICES
TABLE 119. TATA STEEL LIMITED: RECENT DEVELOPMENTS
TABLE 120. TRINITY INDUSTRIES INC: FINANCIALS
TABLE 121. TRINITY INDUSTRIES INC: PRODUCT AND SERVICES
TABLE 122. TRINITY INDUSTRIES INC: RECENT DEVELOPMENTS
TABLE 123. BARRIER1 SYSTEMS INC: FINANCIALS
TABLE 124. BARRIER1 SYSTEMS INC: PRODUCT AND SERVICES
TABLE 125. BARRIER1 SYSTEMS INC: RECENT DEVELOPMENTS
Research Framework
Infoholic Research works on a holistic 360° approach in order to deliver high quality, validated and reliable information in our market reports. The Market estimation and forecasting involves following steps:
- Data Collation (Primary & Secondary)
- In-house Estimation (Based on proprietary data bases and Models)
- Market Triangulation
- Forecasting

Market related information is congregated from both primary and secondary sources.
Primary sources
Involved participants from all global stakeholders such as Solution providers, service providers, Industry associations, thought leaders etc. across levels such as CXOs, VPs and managers. Plus, our in-house industry experts having decades of industry experience contribute their consulting and advisory services.
Secondary sources
Include public sources such as regulatory frameworks, government IT spending, government demographic indicators, industry association statistics, and company publications along with paid sources such as Factiva, OneSource, Bloomberg among others.
![]()


