
Artificial Sweetener Market By Type (Aspartame, Acesulfame, Saccharin, Sucralose Cyclamate and Others) By Application (Food &Beverage, Pharmaceuticals, Direct Sales and others) and By Geography – Global Driver, Restraints, Opportunities, Trends, and Forecast to 2023
- September, 2018
- Domain: Chemicals, Materials & Food - Specialty Chemicals
- Get Free 10% Customization in this Report
The artificial sweetener is a major additive in food & beverage products. In food & beverage, artificial sweetener is mainly classified into aspartame, acesulfame, saccharin, sucralose, cylamate, and others. It provides a sweet taste and low calories to the products turning them into sugar-free products.
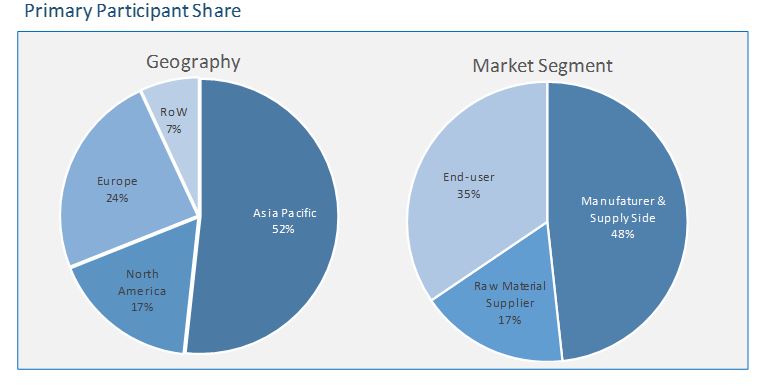
Research Methodology
The artificial sweetener market has been analyzed by utilizing the optimum combination of secondary sources and in-house methodology along with an irreplaceable blend of primary insights. The real-time assessment of the market is an integral part of our market sizing and forecasting methodology. Our industry experts and panel of primary participants have helped in compiling relevant aspects with realistic parametric estimations for a comprehensive study. The participation share of different categories of primary participants is given below:
Key Market Insights
Artificial sweetener is widely utilized in the food & beverages industry in various sugar-free soda, chewing gums, chocolates, ice cream, baked goods, and others. It imparts much more sweetness in these products than sugar. It also keeps the calories low helping the consumers to consume these products without feeling guilty about putting on. The food & beverage segment is growing fast as the demand for sugar-free beverages and sugar-free eatables is increasing owing to the spreading of awareness related to healthy eating and growing health concerns.
Currently, Asia Pacific dominates the market and is expected to grow potentially during the forecast period due to intense demand from various application segments and increasing number of diabetic and obese people. North America is likely to remain as a key region owing to the significant contribution from the US. Few of the prominent key players in the global artificial sweetener market are Cargill, ROQUETTE, AJINOMOTO, Ingredion, and Hermes Sweeteners.
Types:
- Aspartame
- Acesulfame
- Saccharin
- Sucralose
- Cylamate
- Others
Applications:
- Food & Beverage
- Pharmaceuticals
- Direct Sales
- Others
Geography:
- Asia Pacific
- North America
- Europe
- Rest of the World
1 Report Outline
1.1 Introduction
1.2 Report Scope
1.3 Market Definition
1.4 Research Methodology
1.4.1 Data Collation & In-house Estimation
1.4.2 Market Triangulation
1.4.3 Forecasting
1.5 Study Declarations
1.6 Report Assumptions
1.7 Stakeholders
2 Executive Summary
2.1 Asia Pacific Has Highest Growth Rate in the Artificial Sweetener Market
2.2 Food & Beverage is Increasing Its Lead with High Growth Coming from Developing Countries
3 Market Positioning
3.1 Total Addressable Market: Global Sweetener Market
3.1.1 Market Overview
3.1.2 Major Trends
3.2 Segmented Addressable Market
3.3 Related Markets
4 Market Outlook
4.1 Overview
4.2 Value Chain Analysis
4.3 PESTLE Analysis
4.4 Porter 5 (Five) Forces
4.5 Patent Analysis
5 Market Characteristics
5.1 Market Segmentation
5.2 Market Dynamics
5.2.1 Drivers
5.2.2 Restraints
5.2.3 Opportunities
5.2.4 DRO – Impact Analysis
6 By Type: Market Size and Analysis
6.1 Overview
6.2 Aspartame
6.3 Acesulfame
6.4 Saccharin
6.5 Sucralose
6.6 Cylamate
6.7 Vendor Profiles
6.7.1 Cargill Inc.
6.7.2 AJINOMOTO
6.7.3 Hermes Sweeteners
6.7.4 Ingredion
6.7.5 ROQUETTE
(Overview, business units, geographic revenues, product profile, recent developments, business focus, SWOT analysis, and business strategies have been covered for all vendors)
7 Applications: Market Size and Analysis
7.1 Overview
7.2 Food & Beverage
7.3 Pharmaceuticals
7.4 Direct Sales
7.5 Customer Profile
7.5.1 Kraft Heinz
7.5.2 Coca- Cola
7.5.3 Archer Daniels Midland Company
7.5.4 AB InBev
7.5.5 PepsiCo
(Overview, product profile, and business strategies have been covered for all customers)
8 Regions: Market Size and Analysis
8.1 Overview
8.2 Asia Pacific
8.2.1 Asia Pacific Market by Countries
8.2.2 Asia Pacific Market by Type
8.2.3 Asia Pacific Market by Applications
8.3 North America
8.3.1 North America Market by Countries
8.3.2 North America Market by type
8.3.3 North America Market by Applications
8.4 Europe
8.4.1 Europe Market by Country
8.4.2 Europe Market by type
8.4.3 Europe Market by Applications
8.5 Rest of the World
8.5.1 Rest of the World Market by Regions
8.5.2 Rest of the World Market by Type
8.5.3 Rest of the World Market by Applications
9 Companies to watch for
9.1 Evonik Industries
9.1.1 Overview
10 Competitive Landscape
10.1 Competitor Comparison Analysis
10.2 Market Landscape
10.2.1 Mergers, Acquisitions, & Joint Ventures
10.2.2 Expansion & Joint Venture
10.2.3 Exhibition & Product Launch
10.2.4 Awards & Recognition
11 Annexure
 Abbreviations
TABLE 1 GLOBAL ARTIFICIAL SWEETENER MARKET REVENUE, BY TYPE, 2016-2023 ($MILLION)
TABLE 2 GLOBAL ARTIFICIAL SWEETENER MARKET VOLUME, BY TYPE, 2016-2023 (KILOTONS)
TABLE 3 GLOBAL ASPARTAME ARTIFICIAL SWEETENER MARKET REVENUE, BY GEOGRAPHY, 2016-2023 ($MILLION)
TABLE 4 GLOBAL ASPARTAME ARTIFICIAL SWEETENER MARKET VOLUME, BY GEOGRAPHY, 2016-2023 (KILOTONS)
TABLE 5 GLOBAL ACESULFAME ARTIFICIAL SWEETENER MARKET REVENUE, BY GEOGRAPHY, 2016-2023 ($MILLION)
TABLE 6 GLOBAL ACESULFAME ARTIFICIAL SWEETENER MARKET VOLUME, BY GEOGRAPHY, 2016-2023 (KILOTONS)
TABLE 7 GLOBAL SACCHARIN ARTIFICIAL SWEETENER MARKET REVENUE, BY GEOGRAPHY, 2016-2023 ($MILLION)
TABLE 8 GLOBAL SACCHARIN ARTIFICIAL SWEETENER MARKET VOLUME, BY GEOGRAPHY, 2016-2023 (KILOTONS)
TABLE 9 GLOBAL SUCRALOSE ARTIFICIAL SWEETENER MARKET REVENUE, BY GEOGRAPHY, 2016-2023 ($MILLION)
TABLE 10 GLOBAL SUCRALOSE ARTIFICIAL SWEETENER MARKET VOLUME, BY GEOGRAPHY, 2016-2023 (KILOTONS)
TABLE 11 GLOBAL CYLAMATE ARTIFICIAL SWEETENER MARKET REVENUE, BY GEOGRAPHY, 2016-2023 ($MILLION)
TABLE 12 GLOBAL CYLAMATE ARTIFICIAL SWEETENER MARKET VOLUME, BY GEOGRAPHY, 2016-2023 (KILOTONS)
TABLE 13 CARGILL INC.: PRODUCT PROFILE
TABLE 14 CARGILL INC.: RECENT DEVELOPMENTS
TABLE 15 AJINOMOTO: PRODUCT PROFILE
TABLE 16 AJINOMOTO: RECENT DEVELOPMENTS
TABLE 17 HERMES SWEETENERS: PRODUCT PROFILE
TABLE 18 HERMES SWEETENERS: RECENT DEVELOPMENTS
TABLE 19 INGREDION: PRODUCT PROFILE
TABLE 20 INGREDION: RECENT DEVELOPMENTS
TABLE 21 ROQUETTE: PRODUCT PROFILE
TABLE 22 ARKEMA: RECENT DEVELOPMENTS
TABLE 23 GLOBAL ARTIFICIAL SWEETENER MARKET REVENUE BY APPLICATION, 2016-2023 ($MILLION)
TABLE 24 GLOBAL ARTIFICIAL SWEETENER MARKET VOLUME BY APPLICATIONS, 2016-2023 (KILOTONS)
TABLE 25 GLOBAL ARTIFICIAL SWEETENER IN FOOD & BEVERAGE MARKET REVENUE, BY GEOGRAPHY, 2016-2023 ($MILLION)
TABLE 26 GLOBAL ARTIFICIAL SWEETENER IN FOOD & BEVERAGE MARKET VOLUME, BY GEOGRAPHY, 2016-2023 (KILOTONS)
TABLE 27 GLOBAL ARTIFICIAL SWEETENER IN PHARMACEUTICALS MARKET REVENUE, BY GEOGRAPHY, 2016-2023 ($MILLION)
TABLE 28 GLOBAL ARTIFICIAL SWEETENER IN PHARMACEUTICALS MARKET VOLUME, BY GEOGRAPHY, 2016-2023 (KILOTONS)
TABLE 29 GLOBAL ARTIFICIAL SWEETENER IN DIRECT SALES REVENUE, BY GEOGRAPHY, 2016-2023 ($MILLION)
TABLE 30 GLOBAL ARTIFICIAL SWEETENER IN DIRECT SALES MARKET VOLUME, BY GEOGRAPHY, 2016-2023 (KILOTONS)
TABLE 31 KRAFT HEINZ: PRODUCT PROFILE
TABLE 32 COCA-COLA: PRODUCT PROFILE
TABLE 33 ARCHER DANIELS MIDLAND COMPANY: PRODUCT PROFILE
TABLE 34 GLOBAL ARTIFICIAL SWEETENER MARKET VALUE, BY GEOGRAPHY, 2016−2023 ($MILLION)
TABLE 35 GLOBAL ARTIFICIAL SWEETENER MARKET VOLUME, BY GEOGRAPHY, 2016−2023 (KILOTONS)
TABLE 36 ASIA PACIFIC ARTIFICIAL SWEETENER VALUE, BY COUNTRY, 2016−2023 ($MILLION)
TABLE 37 ASIA PACIFIC ARTIFICIAL SWEETENER MARKET VOLUME, BY COUNTRY, 2016−2023 (KILOTONS)
TABLE 38 ASIA PACIFIC ARTIFICIAL SWEETENER MARKET VALUE, BY TYPE, 2016−2023 ($MILLION)
TABLE 39 ASIA PACIFIC ARTIFICIAL SWEETENER MARKET VOLUME, BY TECHNOLOGY, 2016−2023 (KILOTONS)
TABLE 40 ASIA PACIFIC ARTIFICIAL SWEETENER MARKET VALUE, BY APPLICATIONS, 2016−2023 ($MILLION)
TABLE 41 ASIA PACIFIC ARTIFICIAL SWEETENER MARKET VOLUME, BY APPLICATIONS, 2016−2023 (KILOTONS)
TABLE 42 NORTH AMERICA ARTIFICIAL SWEETENER MARKET VALUE, BY COUNTRY, 2016−2023 ($MILLION)
TABLE 43 NORTH AMERICA ARTIFICIAL SWEETENER MARKET VOLUME, BY COUNTRY, 2016−2023 (KILOTONS)
TABLE 44 NORTH AMERICA ARTIFICIAL SWEETENER MARKET VALUE, BY TECHNOLOGY, 2016−2023 ($MILLION)
TABLE 45 NORTH AMERICA ARTIFICIAL SWEETENER MARKET VOLUME, BY TYPE, 2016−2023 (KILOTONS)
TABLE 46 NORTH AMERICA ARTIFICIAL SWEETENER MARKET VALUE, BY END-USER, 2016−2023 ($MILLION)
TABLE 47 NORTH AMERICA ARTIFICIAL SWEETENER MARKET VOLUME, BY APPLICATIONS, 2016−2023 (KILOTONS)
TABLE 48 EUROPE ARTIFICIAL SWEETENER MARKET VALUE, BY COUNTRY, 2016−2023 ($MILLION)
TABLE 49 EUROPE ARTIFICIAL SWEETENER MARKET VOLUME, BY COUNTRY, 2016−2023
TABLE 50 EUROPE ARTIFICIAL SWEETENER MARKET VALUE, BY TYPE, 2016−2023 ($MILLION)
TABLE 51 EUROPE ARTIFICIAL SWEETENER MARKET VOLUME, BY TYPE, 2016−2023 (KILOTONS)
TABLE 52 EUROPE ARTIFICIAL SWEETENER MARKET VALUE, BY APPLICATIONS, 2016−2023 ($MILLION)
TABLE 53 EUROPE ARTIFICIAL SWEETENER MARKET VOLUME, BY APPLICATIONS, 2016−2023 (KILOTONS)
TABLE 54 REST OF THE WORLD ARTIFICIAL SWEETENER MARKET VALUE, BY GEOGRAPHY, 2016−2023 ($MILLION)
TABLE 55 REST OF THE WORLD ARTIFICIAL SWEETENER MARKET VOLUME, BY GEOGRAPHY, 2015−2022 (KILOTONS)
TABLE 56 REST OF THE WORLD ARTIFICIAL SWEETENER MARKET VALUE, BY TYPE, 2016−2023 ($MILLION)
TABLE 57 REST OF THE WORLD ARTIFICIAL SWEETENER MARKET VOLUME, BY TYPE, 2016−2023 (KILOTONS)
TABLE 58 REST OF THE WORLD ARTIFICIAL SWEETENER MARKET VALUE, BY APPLICATIONS, 2016−2023 ($MILLION)
TABLE 59 REST OF THE WORLD ARTIFICIAL SWEETENER MARKET VOLUME, BY APPLICATIONS, 2016−2023 (KILOTONS)
TABLE 60 MERGERS, ACQUISITIONS, & JOINT VENTURES
TABLE 61 EXPANSION
TABLE 62 EXHIBITION & PRODUCT LAUNCH
TABLE 63 AWARDS & RECOGNITION
Research Framework
Infoholic Research works on a holistic 360° approach in order to deliver high quality, validated and reliable information in our market reports. The Market estimation and forecasting involves following steps:
- Data Collation (Primary & Secondary)
- In-house Estimation (Based on proprietary data bases and Models)
- Market Triangulation
- Forecasting

Market related information is congregated from both primary and secondary sources.
Primary sources
Involved participants from all global stakeholders such as Solution providers, service providers, Industry associations, thought leaders etc. across levels such as CXOs, VPs and managers. Plus, our in-house industry experts having decades of industry experience contribute their consulting and advisory services.
Secondary sources
Include public sources such as regulatory frameworks, government IT spending, government demographic indicators, industry association statistics, and company publications along with paid sources such as Factiva, OneSource, Bloomberg among others.
![]()


