
Artificial Lift Market by Well Type (Horizontal, Vertical); Application (Onshore, Offshore), Type (ESP, PCP, Rod Lift, Gas Lift, and Others), and Geography – Global Forecast up to 2026
- April, 2021
- Domain: Electronics & Semiconductors - Electronics & Semiconductors
- Get Free 10% Customization in this Report
Artificial Lift is a method used on oil wells to raise the reservoir's pressure to increase the flow of liquids like crude oil or water. Some reservoirs do not flow logically. Hence, artificial lift methods are working to lift the oil to the surface. These novel methods can be deployed on both mature and new wells to maximize and maintain production. The other advantages of the artificial lift method include reduced maintenance and risk, increased life-of-well productivity, and increased return by balancing flow rates and lifting costs. The two key types of artificial lift methods are pump-assisted and gas-assisted. The market observes significant development due to extensive demand for fossil fuels and the escalating number of settled reserves that comprise a large amount of crude oil. Furthermore, shale gas and heavy oil capabilities further drive the development of the artificial lift market internationally. The market of artificial lift is expected to grow at the rate of 5.63% CAGR by 2026.
Research Methodology:
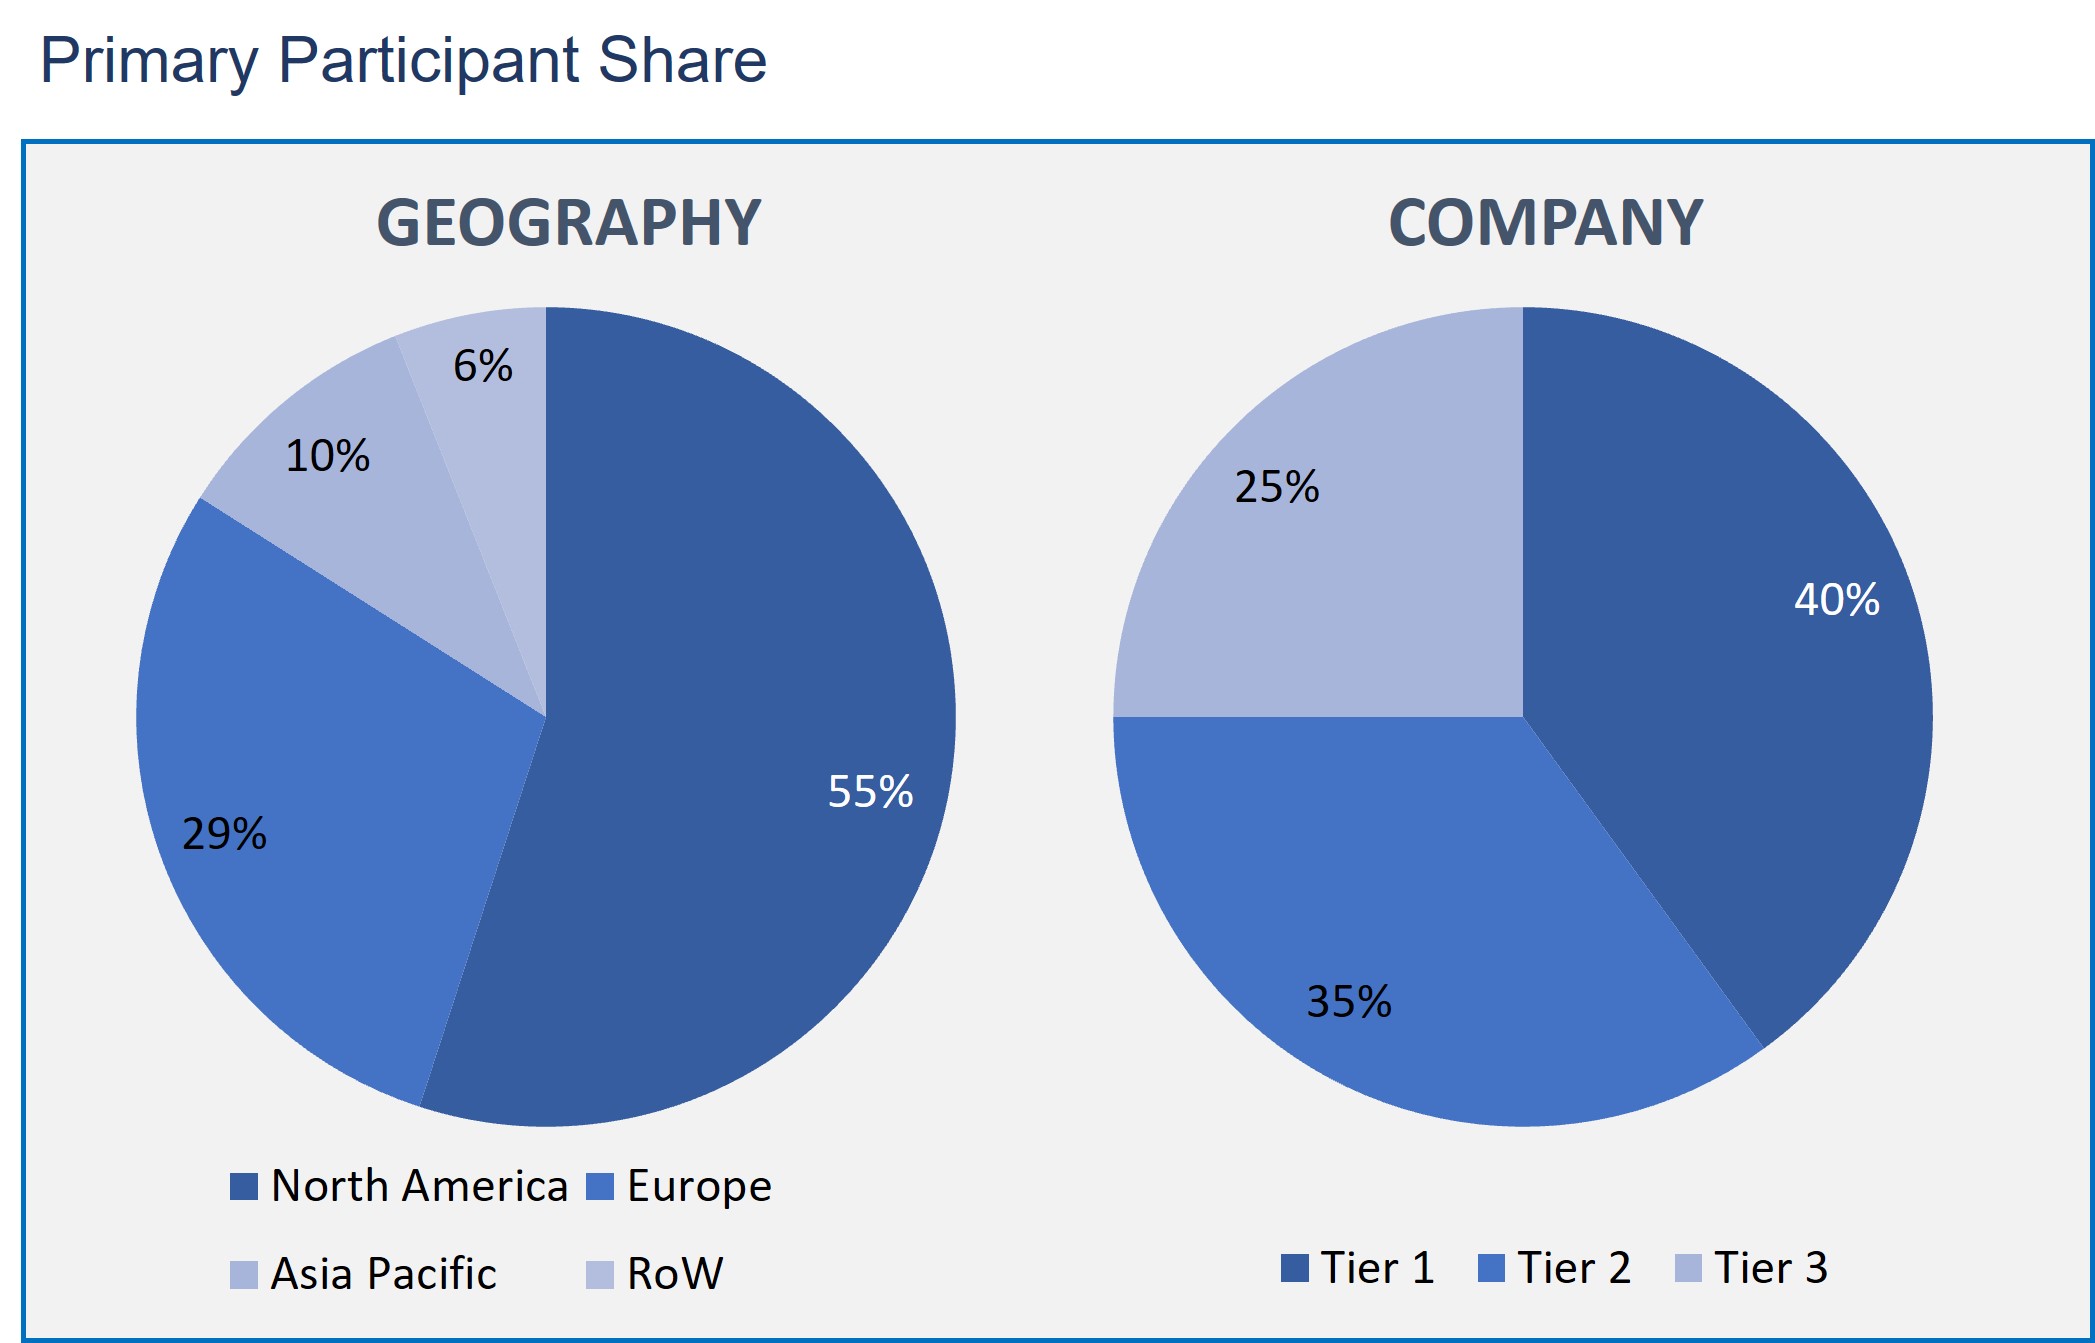
The Artificial Lift market is analyzed by utilizing the optimum combination of secondary sources and in-house methodology and a unique balance of primary insights. The real-time valuation of the market is an integral part of our forecasting and market sizing methodology. Industry experts and our primary participants have helped to compile related aspects with accurate parametric estimations for a complete study. The primary participants share is given below:
Artificial Lift Market by Application
- Offshore
- Onshore
Artificial Lift Market by Well Type
- Vertical
- Horizontal
Artificial Lift Market by Mechanism
- Gas-Assisted
- Pump Assisted
- Positive Displacement
- Dynamic Displacement
Artificial Lift Market by Type
- ESP
- PCP
- Gas Lift
- Rod lift
- Others
Artificial Lift Market by Geography
- North America
- Europe
- Asia Pacific
- Rest of the World
On the basis of application, the offshore segment is anticipated to rise at the fastest rate during the estimated period. Artificial lift methods like gas lift, ESP, hydraulic pumping, and PCP are prominently used in offshore wells. Since the onshore oil & gas reserves have mostly been explored, the companies have been now exploring the offshore locations.
On the basis of type, the segment of ‘rod lift’ is anticipated to make the most significant contribution to the artificial lift market during the estimated period. Rod lift, beam lift, or sucker rod lift mention an artificial lift system that utilizes power source at surface to drive a downhole pump assembly. The unit is made of some components used in both surface and subsurface.
North America is projected to be the largest market from 2020 to 2025, determined by the redevelopment of shale reserves and unconventional resources in the US and Canada. Furthermore, the demand for artificial lift operations in the maturing offshore fields in the Gulf of Mexico and other onshore fields in the US is anticipated to drive market development.
This report gives the profiles of companies leading the Artificial Lift market: Halliburton, Schlumberger, Baker Hughes Company, Weatherford (Switzerland), NOV, Borets International, and Oilserv JJ Tech, Apergy, DistributionNow, Novomet, AccessESP, and Valiant Artificial lift Solutions.
- This report provides a comprehensive analysis of the Artificial Lift market growth drivers, restraints, opportunities, and other related challenges.
- This report depicts the market developments such as new product launches, mergers and acquisitions, diversification, and joint ventures of the market players.
- This report also describes all potential segments and sub-segments present in the market to help the companies in strategic business planning.
- This report also gives the regional analysis of the Artificial Lift market in terms of market penetration across the world.
- Executive Summary
- Industry Outlook
- Industry Overview
- Industry Trends
- Market Snapshot
- Market Definition
- Market Outlook
- Porter Five Forces
- Related Markets
- Market characteristics
- Market Overview
- Market Segmentation
- Market Dynamics
- Drivers
- Restraints
- Opportunities
- DRO - Impact Analysis
- Type: Market Size & Analysis
- Overview
- ESP
- PCP
- Gas Lift
- Rod lift
- Others
- Mechanism: Market Size & Analysis
- Overview
- Pump Assisted
- Positive Displacement
- Dynamic Displacement
- Gas-Assisted
- Geography: Market Size & Analysis
- Overview
- North America
- Europe
- Asia Pacific
- Rest of the World
- Competitive Landscape
- Competitor Comparison Analysis
- Market Developments
- Mergers and Acquisitions, Legal, Awards, Partnerships
- Product Launches and execution
- Vendor Profiles
- Burckhardt Compression Holding AG
- Overview
- Financial Overview
- Product Offerings
- Developments
- Business Strategy
- Mitsubishi Heavy Industries Compressor Corporation
- Overview
- Financial Overview
- Product Offerings
- Developments
- Business Strategy
- Atlas Copco Energas GmbH
- Overview
- Financial Overview
- Product Offerings
- Developments
- Business Strategy
- General Electric Company
- Overview
- Business Units
- Geographic Revenue
- Product Offerings
- Developments
- SWOT Analysis
- Business Strategy
- Man Diesel & Turbo SE
- Overview
- Financial Overview
- Product Offerings
- Developments
- Business Strategy
- Ebara Corporation
- Overview
- Financial Overview
- Product Offerings
- Developments
- Business Strategy
- Ariel Corporation
- Overview
- Financial Overview
- Product Offerings
- Developments
- Business Strategy
- Solar Turbine Inc.
- Overview
- Financial Overview
- Product Offerings
- Developments
- Business Strategy
- Neuman & Esser Group
- Overview
- Financial Overview
- Product Offerings
- Developments
- Business Strategy
- Hitachi, Ltd.
- Overview
- Financial Overview
- Product Offerings
- Developments
- Business Strategy
- Burckhardt Compression Holding AG
- Analyst Opinion
- Annexure
- Report Scope
- Market Definitions
- Research Methodology
- Data Collation and In-house Estimation
- Market Triangulation
- Forecasting
- Report Assumptions
- Declarations
- Stakeholders
- Abbreviations
TABLE 1. GLOBAL ARTIFICIAL LIFT MARKET VALUE, BY TYPE, 2020-2026 (USD BILLION)
TABLE 2. GLOBAL ARTIFICIAL LIFT MARKET VALUE FOR ESP, BY GEOGRAPHY, 2020-2026 (USD BILLION)
TABLE 3. GLOBAL ARTIFICIAL LIFT MARKET VALUE FOR PCP, BY GEOGRAPHY, 2020-2026 (USD BILLION)
TABLE 4. GLOBAL ARTIFICIAL LIFT MARKET VALUE FOR GAS LIFT, BY GEOGRAPHY, 2020-2026 (USD BILLION)
TABLE 5. GLOBAL ARTIFICIAL LIFT MARKET VALUE FOR ROD LIFT, BY GEOGRAPHY, 2020-2026 (USD BILLION)
TABLE 6. GLOBAL ARTIFICIAL LIFT MARKET VALUE FOR OTHERS, BY GEOGRAPHY, 2020-2026 (USD BILLION)
TABLE 7. GLOBAL ARTIFICIAL LIFT MARKET VALUE, BY MECHANISM, 2020-2026 (USD BILLION)
TABLE 8. GLOBAL ARTIFICIAL LIFT MARKET VALUE FOR PUMP ASSISTED, 2020-2026 (USD BILLION)
TABLE 9. GLOBAL ARTIFICIAL LIFT MARKET VALUE FOR POSITIVE DISPLACEMENT, BY TYPE, 2020-2026 (USD BILLION)
TABLE 10. GLOBAL ARTIFICIAL LIFT MARKET VALUE FOR DYNAMIC DISPLACEMENT, BY TYPE, 2020-2026 (USD BILLION)
TABLE 11. GLOBAL ARTIFICIAL LIFT MARKET VALUE FOR GAS-ASSISTED, BY GEOGRAPHY, 2020-2026 (USD BILLION)
TABLE 12. NORTH AMERICA ARTIFICIAL LIFT MARKET VALUE, BY COUNTRY, 2020-2026 (USD BILLION)
TABLE 13. NORTH AMERICA ARTIFICIAL LIFT MARKET VALUE, BY TYPE, 2020-2026 (USD BILLION)
TABLE 14. NORTH AMERICA ARTIFICIAL LIFT MARKET VALUE, BY MECHANISM, 2020-2026 (USD BILLION)
TABLE 15. U.S ARTIFICIAL LIFT MARKET VALUE, BY TYPE, 2020-2026 (USD BILLION)
TABLE 16. U.S ARTIFICIAL LIFT MARKET VALUE, BY MECHANISM, 2020-2026 (USD BILLION)
TABLE 17. CANADA ARTIFICIAL LIFT MARKET VALUE, BY TYPE, 2020-2026 (USD BILLION)
TABLE 18. CANADA ARTIFICIAL LIFT MARKET VALUE, BY MECHANISM, 2020-2026 (USD BILLION)
TABLE 19. EUROPE ARTIFICIAL LIFT MARKET VALUE, BY COUNTRY, 2020-2026 (USD BILLION)
TABLE 20. EUROPE ARTIFICIAL LIFT MARKET VALUE, BY TYPE, 2020-2026 (USD BILLION)
TABLE 21. EUROPE ARTIFICIAL LIFT MARKET VALUE, MECHANISM, 2020-2026 (USD BILLION)
TABLE 22. GERMANY ARTIFICIAL LIFT MARKET VALUE, BY TYPE, 2020-2026 (USD BILLION)
TABLE 23. GERMANY ARTIFICIAL LIFT MARKET VALUE, BY MECHANISM, 2020-2026 (USD BILLION)
TABLE 24. U.K ARTIFICIAL LIFT MARKET VALUE, BY TYPE, 2020-2026 (USD BILLION)
TABLE 25. U.K ARTIFICIAL LIFT MARKET VALUE, BY MECHANISM, 2020-2026 (USD BILLION)
TABLE 26. FRANCE ARTIFICIAL LIFT MARKET VALUE, BY TYPE, 2020-2026 (USD BILLION)
TABLE 27. FRANCE ARTIFICIAL LIFT MARKET VALUE, BY MECHANISM, 2020-2026 (USD BILLION)
TABLE 28. ITALY ARTIFICIAL LIFT MARKET VALUE, BY TYPE, 2020-2026 (USD BILLION)
TABLE 29. ITALY ARTIFICIAL LIFT MARKET VALUE, BY MECHANISM, 2020-2026 (USD BILLION)
TABLE 30. SPAIN ARTIFICIAL LIFT MARKET VALUE, BY TYPE, 2020-2026 (USD BILLION)
TABLE 31. SPAIN ARTIFICIAL LIFT MARKET VALUE, BY MECHANISM, 2020-2026 (USD BILLION)
TABLE 32. ROE ARTIFICIAL LIFT MARKET VALUE, BY TYPE, 2020-2026 (USD BILLION)
TABLE 33. ROE ARTIFICIAL LIFT MARKET VALUE, BY MECHANISM, 2020-2026 (USD BILLION)
TABLE 34. ASIA PACIFIC ARTIFICIAL LIFT MARKET VALUE, BY COUNTRY, 2020-2026 (USD BILLION)
TABLE 35. ASIA PACIFIC ARTIFICIAL LIFT MARKET VALUE, BY TYPE, 2020-2026 (USD BILLION)
TABLE 36. ASIA PACIFIC ARTIFICIAL LIFT MARKET VALUE, BY MECHANISM, 2020-2026 (USD BILLION)
TABLE 37. CHINA ARTIFICIAL LIFT MARKET VALUE, BY TYPE, 2020-2026 (USD BILLION)
TABLE 38. CHINA ARTIFICIAL LIFT MARKET VALUE, BY MECHANISM, 2020-2026 (USD BILLION)
TABLE 39. INDIA ARTIFICIAL LIFT MARKET VALUE, BY TYPE, 2020-2026 (USD BILLION)
TABLE 40. INDIA ARTIFICIAL LIFT MARKET VALUE, BY MECHANISM, 2020-2026 (USD BILLION)
TABLE 41. JAPAN ARTIFICIAL LIFT MARKET VALUE, BY TYPE, 2020-2026 (USD BILLION)
TABLE 42. JAPAN ARTIFICIAL LIFT MARKET VALUE, BY MECHANISM, 2020-2026 (USD BILLION)
TABLE 43. REST OF APAC ARTIFICIAL LIFT MARKET VALUE, BY TYPE, 2020-2026 (USD BILLION)
TABLE 44. REST OF APAC ARTIFICIAL LIFT MARKET VALUE, BY MECHANISM, 2020-2026 (USD BILLION)
TABLE 45. REST OF WORLD ARTIFICIAL LIFT MARKET VALUE, BY TYPE, 2020-2026 (USD BILLION)
TABLE 46. REST OF WORLD ARTIFICIAL LIFT MARKET VALUE, BY MECHANISM, 2020-2026 (USD BILLION)
TABLE 47. BURCKHARDT COMPRESSION HOLDING AG: FINANCIALS
TABLE 48. BURCKHARDT COMPRESSION HOLDING AG: PRODUCTS & SERVICES
TABLE 49. BURCKHARDT COMPRESSION HOLDING AG: RECENT DEVELOPMENTS
TABLE 50. MITSUBISHI HEAVY INDUSTRIES COMPRESSOR CORPORATION: FINANCIALS
TABLE 51. MITSUBISHI HEAVY INDUSTRIES COMPRESSOR CORPORATION: PRODUCTS & SERVICES
TABLE 52. MITSUBISHI HEAVY INDUSTRIES COMPRESSOR CORPORATION: RECENT DEVELOPMENTS
TABLE 53. ATLAS COPCO ENERGAS GMBH: FINANCIALS
TABLE 54. ATLAS COPCO ENERGAS GMBH: PRODUCTS & SERVICES
TABLE 55. ATLAS COPCO ENERGAS GMBH: RECENT DEVELOPMENTS
TABLE 56. GENERAL ELECTRIC COMPANY: FINANCIALS
TABLE 57. GENERAL ELECTRIC COMPANY: PRODUCTS & SERVICES
TABLE 58. GENERAL ELECTRIC COMPANY: RECENT DEVELOPMENTS
TABLE 59. MAN DIESEL & TURBO SE: FINANCIALS
TABLE 60. MAN DIESEL & TURBO SE: PRODUCTS & SERVICES
TABLE 61. MAN DIESEL & TURBO SE: RECENT DEVELOPMENTS
TABLE 62. EBARA CORPORATION: FINANCIALS
TABLE 63. EBARA CORPORATION: PRODUCTS & SERVICES
TABLE 64. EBARA CORPORATION: RECENT DEVELOPMENTS
TABLE 65. ARIEL CORPORATION: FINANCIALS
TABLE 66. ARIEL CORPORATION: PRODUCTS & SERVICES
TABLE 67. ARIEL CORPORATION: RECENT DEVELOPMENTS
TABLE 68. SOLAR TURBINE INC: FINANCIALS
TABLE 69. SOLAR TURBINE INC: PRODUCTS & SERVICES
TABLE 70. SOLAR TURBINE INC: RECENT DEVELOPMENTS
TABLE 71. NEUMAN & ESSER GROUP: FINANCIALS
TABLE 72. NEUMAN & ESSER GROUP: PRODUCTS & SERVICES
TABLE 73. NEUMAN & ESSER GROUP: RECENT DEVELOPMENTS
TABLE 74. HITACHI, LTD: FINANCIALS
TABLE 75. HITACHI, LTD: PRODUCTS & SERVICES
TABLE 76. HITACHI, LTD: RECENT DEVELOPMENTS
Research Framework
Infoholic Research works on a holistic 360° approach in order to deliver high quality, validated and reliable information in our market reports. The Market estimation and forecasting involves following steps:
- Data Collation (Primary & Secondary)
- In-house Estimation (Based on proprietary data bases and Models)
- Market Triangulation
- Forecasting

Market related information is congregated from both primary and secondary sources.
Primary sources
Involved participants from all global stakeholders such as Solution providers, service providers, Industry associations, thought leaders etc. across levels such as CXOs, VPs and managers. Plus, our in-house industry experts having decades of industry experience contribute their consulting and advisory services.
Secondary sources
Include public sources such as regulatory frameworks, government IT spending, government demographic indicators, industry association statistics, and company publications along with paid sources such as Factiva, OneSource, Bloomberg among others.
![]()


