
Application Container Market by Service (Monitoring & Security, Data Management & Orchestration, Networking, Support & Maintenance, and Other Consulting Services), Deployment (Cloud and On-premise), Organization Size (SMEs and Large Enterprises), Application (BFSI, Healthcare & Life Science, Telecommunication & IT, Retail & E-commerce, Media & Entertainment, and Others) and Geography – Global Forecast up to 2027
- July, 2021
- Domain: ICT - Software & Services
- Get Free 10% Customization in this Report
Application containerization is majorly an OS-level or operating-system-level virtualization system. This method helps run and deploy distributed applications without introducing an entire virtual machine for every app. Moreover, several isolated systems can access a single kernel, and also, it can work on a single control host. The recent trend obtaining an interest in the application container market is the rising deployment rate of hybrid cloud technology. The application container market is expanding considerably owing to the increasing usage of cloud-based computing systems in organizations. Cloud computing players primarily provide multitenancy services, which can offer a single set of software applications simultaneously for more than one customer. The multitenancy cloud environment helps enterprises in reducing the cost of running technology by sharing information technology resources. However, the security risks related to the application container technology are set to limit the market growth. Therefore, the Application Container Market is projected to grow at the rate of 15.83% CAGR by 2027.
Research Methodology:
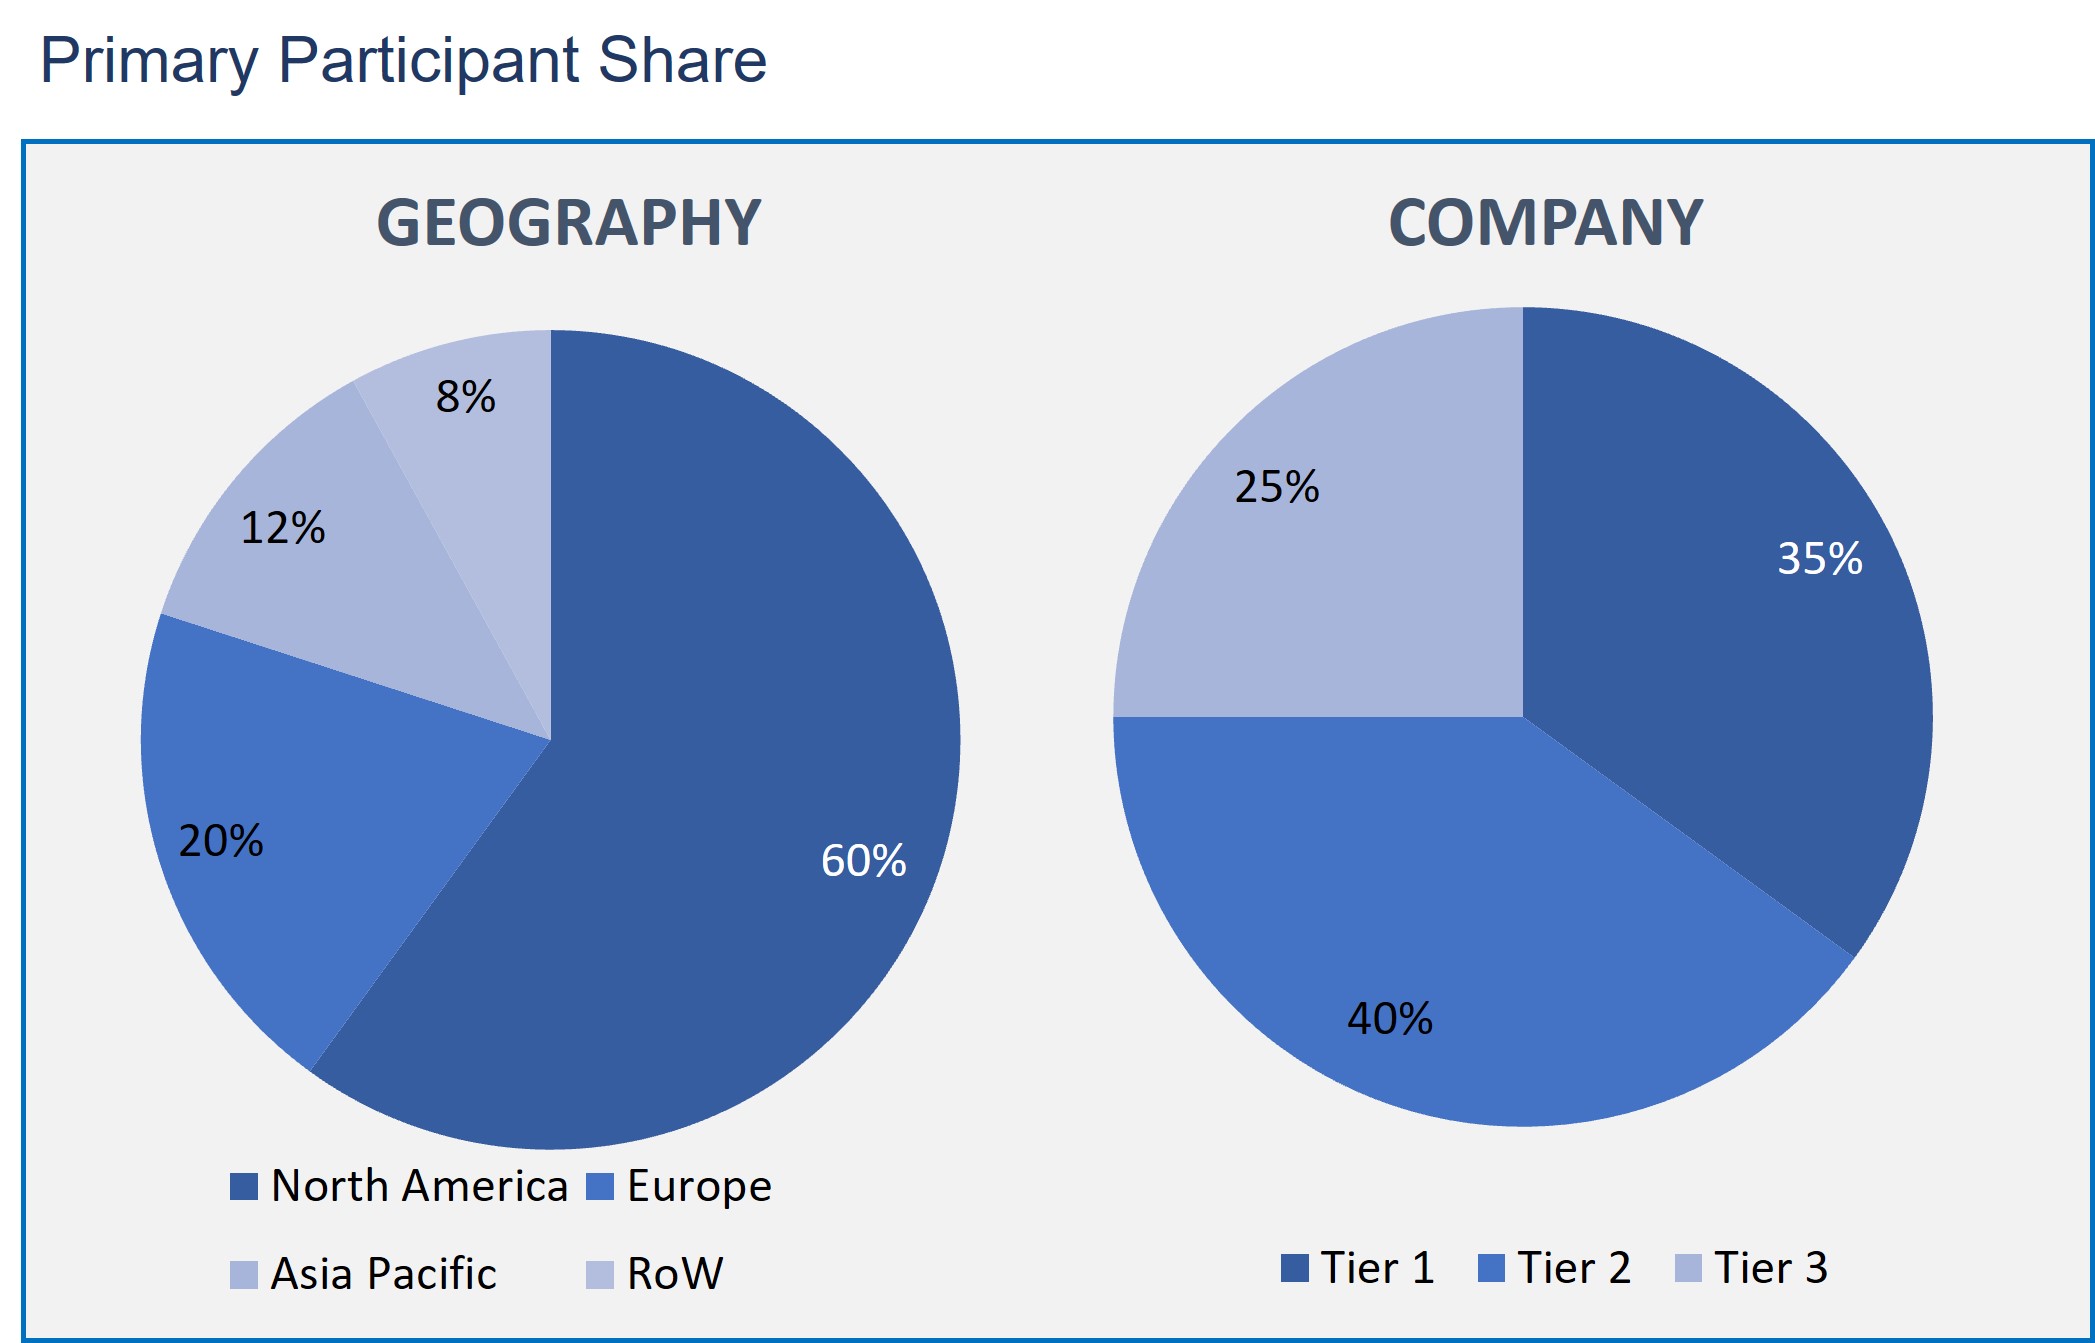
The Application Container Market has been analyzed by utilizing the optimum combination of secondary sources and in-house methodology and a unique balance of primary insights. The real-time valuation of the market is an integral part of our forecasting and market sizing methodology. Industry experts and our primary participants have helped to compile related aspects with accurate parametric estimations for a complete study. The primary participants share is given below:
Application Container Market by Service
- Monitoring & Security
- Data Management & Orchestration
- Networking
- Support & Maintenance
- Other Consulting Services
Application Container Market by Deployment
- Cloud
- On-premise
Application Container Market by Organization Size
- SMEs
- Large Enterprises
Application Container Market by Application
- BFSI
- Healthcare & Life Science
- Telecommunication & IT
- Retail & E-commerce
- Media & Entertainment
- Others
Application Container Market by Geography
- North America
- Europe
- Asia Pacific
- Rest of the World
Data management and orchestration are set to dominate the market based on service. This is due to the ability of containers to employ and manage data quickly. North America is projected to be the highest adopter of these solutions among all verticals. In addition, the region is an prompt adopter of new innovative technologies, including DevOps, hybrid cloud, and containerization, due to the existence of key technology providers.
As per the deployment, the cloud deployment segment is witnessing the highest growth rate. Organizations keep their data in a captive data center over the cloud and have complete control over processes, including scheduling, processing, maintenance, and administration. High capital investments and costs incurred in developing and maintaining on-premise infrastructure are key factors leading to the rising adoption of cloud deployment.
Based on the organization's size, the large enterprise is considered the highest adopter of the application container with a major share in the market. This is because large enterprises have a vital infrastructure, robust R&D capabilities, and higher budgets, which enable the adoption of application containers. The advantages of application containers include cost-effectiveness, easy management and administration, and simple architecture.
As in the application market, the banking, financial services, and insurance (BFSI) sector is expected to have a major share. The use of containerization in the BFSI sector is increasing remarkably due to its advantages, such as ease of administration, cost-effectiveness, and a secured environment.
North America region captured a substantial share of the market. The substantial share is attributed to the rapid adoption of cloud-native technologies by players in the region. In addition, their partnership with other technology providers is a key factor for the market growth in the region.
Cloud computing players worldwide are providing multitenancy services, which offer more than one customer at the same time a single set of software applications. Adopting a multi-tenancy cloud environment assists enterprises in reducing the cost of running a technology by sharing information technology resources. Therefore, the emergence of multitenancy services is projected to increase the adoption of cloud computing eventually augments the global market growth.
Key vendors operating in the application container market are Amazon Web Services, Inc., Rancher Labs, Inc., Red Hat, Inc., CA Technologies, Docker Inc., Google, Inc., IBM Corporation, Joyent, Inc., Mesosphere, Inc. and Microsoft Corporation.
Henceforth, in the modern digital world, IT remains under acute pressure to build business agility, embrace flexibility and adapt to the market’s shifting demands. One such challenge is the provision of applications at the deft pace demanded by the typical digital transformation where application containers emerged as the solution.
- The report provides complete information on the application container market with respect to the drivers, restraints, opportunities, challenges, trends, size, and growth.
- This report gives in-depth information on the segments and sub-segments and their shares in the application container market
- This report further provides information on the product innovation, developments and new product promotions in the market.
- Also, emphasize the competitive outlook of the market key vendors, market share, benchmarking, investments, and merger acquisitions.
- Executive Summary
- Industry Outlook
- Industry Overview
- Industry Trends
- Market Snapshot
- Market Definition
- Market Outlook
- Porter Five Forces
- Related Markets
- Market characteristics
- Market Overview
- Market Segmentation
- Market Dynamics
- Drivers
- Restraints
- Opportunities
- DRO - Impact Analysis
- Service: Market Size & Analysis
- Overview
- Monitoring & Security
- Data Management & Orchestration
- Networking
- Support & Maintenance
- Other Consulting Services
- Deployment: Market Size & Analysis
- Overview
- Cloud
- On-premise
- Organization Size: Market Size & Analysis
- Overview
- SMEs
- Large Enterprises
- Application: Market Size & Analysis
- BFSI
- Healthcare & Life Science
- Telecommunication & IT
- Retail & E-commerce
- Media & Entertainment
- Others
- Geography: Market Size & Analysis
- Overview
- North America
- Europe
- Asia Pacific
- Rest of the World
- Competitive Landscape
- Competitor Comparison Analysis
- Market Developments
- Mergers and Acquisitions, Legal, Awards, Partnerships
- Product Launches and execution
- Vendor Profiles
- Amazon Web Services, Inc.
- Overview
- Financial Overview
- Product Offerings
- Developments
- Business Strategy
- Rancher Labs, Inc.
- Overview
- Financial Overview
- Product Offerings
- Developments
- Business Strategy
- Red Hat, Inc.
- Overview
- Financial Overview
- Product Offerings
- Developments
- Business Strategy
- CA Technologies
- Overview
- Financial Overview
- Product Offerings
- Developments
- Business Strategy
- Docker Inc.
- Overview
- Financial Overview
- Product Offerings
- Developments
- Business Strategy
- Google, Inc.
- Overview
- Financial Overview
- Product Offerings
- Developments
- Business Strategy
- IBM Corporation
- Overview
- Financial Overview
- Product Offerings
- Developments
- Business Strategy
- Joyent, Inc.
- Overview
- Financial Overview
- Product Offerings
- Developments
- Business Strategy
- Mesosphere, Inc
- Overview
- Financial Overview
- Product Offerings
- Developments
- Business Strategy
- Microsoft Corporation
- Overview
- Financial Overview
- Product Offerings
- Developments
- Business Strategy
- Amazon Web Services, Inc.
- Analyst Opinion
- Annexure
- Report Scope
- Market Definitions
- Research Methodology
- Data Collation and In-house Estimation
- Market Triangulation
- Forecasting
- Report Assumptions
- Declarations
- Stakeholders
- Abbreviations
TABLE 1. GLOBAL APPLICATION CONTAINER MARKET VALUE, BY SERVICE, 2021-2027 (USD BILLION)
TABLE 2. GLOBAL APPLICATION CONTAINER MARKET VALUE FOR MONITORING & SECURITY, BY GEOGRAPHY, 2021-2027 (USD BILLION)
TABLE 3. GLOBAL APPLICATION CONTAINER MARKET VALUE FOR DATA MANAGEMENT & ORCHESTRATION, 2021-2027 (USD BILLION)
TABLE 4. GLOBAL APPLICATION CONTAINER MARKET VALUE FOR NETWORKING, BY GEOGRAPHY, 2021-2027 (USD BILLION)
TABLE 5. GLOBAL APPLICATION CONTAINER MARKET VALUE FOR SUPPORT & MAINTENANCE, BY GEOGRAPHY, 2021-2027 (USD BILLION)
TABLE 6. GLOBAL APPLICATION CONTAINER MARKET VALUE FOR OTHER CONSULTING SERVICES, BY GEOGRAPHY, 2021-2027 (USD BILLION)
TABLE 7. GLOBAL APPLICATION CONTAINER MARKET VALUE, BY DEPLOYMENT, 2021-2027 (USD BILLION)
TABLE 8. GLOBAL APPLICATION CONTAINER MARKET VALUE FOR CLOUD, BY GEOGRAPHY, 2021-2027 (USD BILLION)
TABLE 9. GLOBAL APPLICATION CONTAINER MARKET VALUE FOR ON-PREMISE, BY GEOGRAPHY, 2021-2027 (USD BILLION)
TABLE 10. GLOBAL APPLICATION CONTAINER MARKET VALUE, BY ORGANIZATION SIZE, 2021-2027 (USD BILLION)
TABLE 11. GLOBAL APPLICATION CONTAINER MARKET VALUE FOR SMES, 2021-2027 (USD BILLION)
TABLE 12. GLOBAL APPLICATION CONTAINER MARKET VALUE FOR LARGE ENTERPRISES, BY GEOGRAPHY, 2021-2027 (USD BILLION)
TABLE 13. GLOBAL APPLICATION CONTAINER MARKET VALUE, APPLICATION, 2021-2027 (USD BILLION)
TABLE 14. GLOBAL APPLICATION CONTAINER MARKET VALUE FOR BFSI, BY GEOGRAPHY, 2021-2027 (USD BILLION)
TABLE 15. GLOBAL APPLICATION CONTAINER MARKET VALUE FOR HEALTHCARE & LIFE SCIENCE, BY GEOGRAPHY, 2021-2027 (USD BILLION)
TABLE 16. GLOBAL APPLICATION CONTAINER MARKET VALUE FOR TELECOMMUNICATION & IT, BY GEOGRAPHY, 2021-2027 (USD BILLION)
TABLE 17. GLOBAL APPLICATION CONTAINER MARKET VALUE FOR RETAIL & E-COMMERCE, BY GEOGRAPHY, 2021-2027 (USD BILLION)
TABLE 18. GLOBAL APPLICATION CONTAINER MARKET VALUE FOR MEDIA & ENTERTAINMENT, BY GEOGRAPHY, 2021-2027 (USD BILLION)
TABLE 19. GLOBAL APPLICATION CONTAINER MARKET VALUE FOR OTHERS, BY GEOGRAPHY, 2021-2027 (USD BILLION)
TABLE 20. NORTH AMERICA APPLICATION CONTAINER MARKET VALUE, BY COUNTRY, 2021-2027 (USD BILLION)
TABLE 21. NORTH AMERICA APPLICATION CONTAINER MARKET VALUE, BY SERVICE, 2021-2027 (USD BILLION)
TABLE 22. NORTH AMERICA APPLICATION CONTAINER MARKET VALUE, BY DEPLOYMENT, 2021-2027 (USD BILLION)
TABLE 23. NORTH AMERICA APPLICATION CONTAINER MARKET VALUE, BY ORGANIZATION SIZE, 2021-2027 (USD BILLION)
TABLE 24. NORTH AMERICA APPLICATION CONTAINER MARKET VALUE, BY APPLICATION, 2021-2027 (USD BILLION)
TABLE 25. U.S APPLICATION CONTAINER MARKET VALUE, BY SERVICE, 2021-2027 (USD BILLION)
TABLE 26. U.S APPLICATION CONTAINER MARKET VALUE, BY DEPLOYMENT, 2021-2027 (USD BILLION)
TABLE 27. U.S APPLICATION CONTAINER MARKET VALUE, BY ORGANIZATION SIZE, 2021-2027 (USD BILLION)
TABLE 28. U.S APPLICATION CONTAINER MARKET VALUE, BY APPLICATION, 2021-2027 (USD BILLION)
TABLE 29. CANADA APPLICATION CONTAINER MARKET VALUE, BY SERVICE, 2021-2027 (USD BILLION)
TABLE 30. CANADA APPLICATION CONTAINER MARKET VALUE, BY DEPLOYMENT, 2021-2027 (USD BILLION)
TABLE 31. CANADA APPLICATION CONTAINER MARKET VALUE, BY ORGANIZATION SIZE, 2021-2027 (USD BILLION)
TABLE 32. CANADA APPLICATION CONTAINER MARKET VALUE, BY APPLICATION, 2021-2027 (USD BILLION)
TABLE 33. EUROPE APPLICATION CONTAINER MARKET VALUE, BY COUNTRY, 2021-2027 (USD BILLION)
TABLE 34. EUROPE APPLICATION CONTAINER MARKET VALUE, BY SERVICE, 2021-2027 (USD BILLION)
TABLE 35. EUROPE APPLICATION CONTAINER MARKET VALUE, BY DEPLOYMENT, 2021-2027 (USD BILLION)
TABLE 36. EUROPE APPLICATION CONTAINER MARKET VALUE, BY ORGANIZATION SIZE, 2021-2027 (USD BILLION)
TABLE 37. EUROPE APPLICATION CONTAINER MARKET VALUE, BY APPLICATION, 2021-2027 (USD BILLION)
TABLE 38. GERMANY APPLICATION CONTAINER MARKET VALUE, BY SERVICE, 2021-2027 (USD BILLION)
TABLE 39. GERMANY APPLICATION CONTAINER MARKET VALUE, BY DEPLOYMENT, 2021-2027 (USD BILLION)
TABLE 40. GERMANY APPLICATION CONTAINER MARKET VALUE, BY ORGANIZATION SIZE, 2021-2027 (USD BILLION)
TABLE 41. GERMANY APPLICATION CONTAINER MARKET VALUE, BY APPLICATION, 2021-2027 (USD BILLION)
TABLE 42. U.K APPLICATION CONTAINER MARKET VALUE, BY SERVICE, 2021-2027 (USD BILLION)
TABLE 43. U.K APPLICATION CONTAINER MARKET VALUE, BY DEPLOYMENT, 2021-2027 (USD BILLION)
TABLE 44. U.K APPLICATION CONTAINER MARKET VALUE, BY ORGANIZATION SIZE, 2021-2027 (USD BILLION)
TABLE 45. U.K APPLICATION CONTAINER MARKET VALUE, BY APPLICATION, 2021-2027 (USD BILLION)
TABLE 46. FRANCE APPLICATION CONTAINER MARKET VALUE, BY SERVICE, 2021-2027 (USD BILLION)
TABLE 47. FRANCE APPLICATION CONTAINER MARKET VALUE, BY DEPLOYMENT, 2021-2027 (USD BILLION)
TABLE 48. FRANCE APPLICATION CONTAINER MARKET VALUE, BY ORGANIZATION SIZE, 2021-2027 (USD BILLION)
TABLE 49. FRANCE APPLICATION CONTAINER MARKET VALUE, BY APPLICATION, 2021-2027 (USD BILLION)
TABLE 50. ITALY APPLICATION CONTAINER MARKET VALUE, BY SERVICE, 2021-2027 (USD BILLION)
TABLE 51. ITALY APPLICATION CONTAINER MARKET VALUE, BY DEPLOYMENT, 2021-2027 (USD BILLION)
TABLE 52. ITALY APPLICATION CONTAINER MARKET VALUE, BY ORGANIZATION SIZE, 2021-2027 (USD BILLION)
TABLE 53. ITALY APPLICATION CONTAINER MARKET VALUE, BY APPLICATION, 2021-2027 (USD BILLION)
TABLE 54. SPAIN APPLICATION CONTAINER MARKET VALUE, BY SERVICE, 2021-2027 (USD BILLION)
TABLE 55. SPAIN APPLICATION CONTAINER MARKET VALUE, BY DEPLOYMENT, 2021-2027 (USD BILLION)
TABLE 56. SPAIN APPLICATION CONTAINER MARKET VALUE, BY ORGANIZATION SIZE, 2021-2027 (USD BILLION)
TABLE 57. SPAIN APPLICATION CONTAINER MARKET VALUE, BY APPLICATION, 2021-2027 (USD BILLION)
TABLE 58. ROE APPLICATION CONTAINER MARKET VALUE, BY SERVICE, 2021-2027 (USD BILLION)
TABLE 59. ROE APPLICATION CONTAINER MARKET VALUE, BY DEPLOYMENT, 2021-2027 (USD BILLION)
TABLE 60. ROE APPLICATION CONTAINER MARKET VALUE, BY ORGANIZATION SIZE, 2021-2027 (USD BILLION)
TABLE 61. ROE APPLICATION CONTAINER MARKET VALUE, BY APPLICATION, 2021-2027 (USD BILLION)
TABLE 62. ASIA PACIFIC APPLICATION CONTAINER MARKET VALUE, BY COUNTRY, 2021-2027 (USD BILLION)
TABLE 63. ASIA PACIFIC APPLICATION CONTAINER MARKET VALUE, BY SERVICE, 2021-2027 (USD BILLION)
TABLE 64. ASIA PACIFIC APPLICATION CONTAINER MARKET VALUE, BY DEPLOYMENT, 2021-2027 (USD BILLION)
TABLE 65. ASIA PACIFIC APPLICATION CONTAINER MARKET VALUE, BY ORGANIZATION SIZE, 2021-2027 (USD BILLION)
TABLE 66. ASIA PACIFIC APPLICATION CONTAINER MARKET VALUE, BY APPLICATION, 2021-2027 (USD BILLION)
TABLE 67. CHINA APPLICATION CONTAINER MARKET VALUE, BY SERVICE, 2021-2027 (USD BILLION)
TABLE 68. CHINA APPLICATION CONTAINER MARKET VALUE, BY DEPLOYMENT, 2021-2027 (USD BILLION)
TABLE 69. CHINA APPLICATION CONTAINER MARKET VALUE, BY ORGANIZATION SIZE, 2021-2027 (USD BILLION)
TABLE 70. CHINA APPLICATION CONTAINER MARKET VALUE, BY APPLICATION, 2021-2027 (USD BILLION)
TABLE 71. INDIA APPLICATION CONTAINER MARKET VALUE, BY SERVICE, 2021-2027 (USD BILLION)
TABLE 72. INDIA APPLICATION CONTAINER MARKET VALUE, BY DEPLOYMENT, 2021-2027 (USD BILLION)
TABLE 73. INDIA APPLICATION CONTAINER MARKET VALUE, BY ORGANIZATION SIZE, 2021-2027 (USD BILLION)
TABLE 74. INDIA APPLICATION CONTAINER MARKET VALUE, BY APPLICATION, 2021-2027 (USD BILLION)
TABLE 75. JAPAN APPLICATION CONTAINER MARKET VALUE, BY SERVICE, 2021-2027 (USD BILLION)
TABLE 76. JAPAN APPLICATION CONTAINER MARKET VALUE, BY DEPLOYMENT, 2021-2027 (USD BILLION)
TABLE 77. JAPAN APPLICATION CONTAINER MARKET VALUE, BY ORGANIZATION SIZE, 2021-2027 (USD BILLION)
TABLE 78. JAPAN APPLICATION CONTAINER MARKET VALUE, BY APPLICATION, 2021-2027 (USD BILLION)
TABLE 79. REST OF APAC APPLICATION CONTAINER MARKET VALUE, BY SERVICE, 2021-2027 (USD BILLION)
TABLE 80. REST OF APAC APPLICATION CONTAINER MARKET VALUE, BY DEPLOYMENT, 2021-2027 (USD BILLION)
TABLE 81. REST OF APAC APPLICATION CONTAINER MARKET VALUE, BY ORGANIZATION SIZE, 2021-2027 (USD BILLION)
TABLE 82. REST OF APAC APPLICATION CONTAINER MARKET VALUE, BY APPLICATION, 2021-2027 (USD BILLION)
TABLE 83. REST OF WORLD APPLICATION CONTAINER MARKET VALUE, BY SERVICE, 2021-2027 (USD BILLION)
TABLE 84. REST OF WORLD APPLICATION CONTAINER MARKET VALUE, BY DEPLOYMENT, 2021-2027 (USD BILLION)
TABLE 85. REST OF WORLD APPLICATION CONTAINER MARKET VALUE, BY ORGANIZATION SIZE, 2021-2027 (USD BILLION)
TABLE 86. REST OF WORLD APPLICATION CONTAINER MARKET VALUE, BY APPLICATION, 2021-2027 (USD BILLION)
TABLE 87. AMAZON WEB SERVICES, INC: FINANCIALS
TABLE 88. AMAZON WEB SERVICES, INC: SERVICES & SERVICES
TABLE 89. AMAZON WEB SERVICES, INC: RECENT DEVELOPMENTS
TABLE 90. RANCHER LABS, INC: FINANCIALS
TABLE 91. RANCHER LABS, INC: SERVICES & SERVICES
TABLE 92. RANCHER LABS, INC: RECENT DEVELOPMENTS
TABLE 93. RED HAT, INC: FINANCIALS
TABLE 94. RED HAT, INC: SERVICES & SERVICES
TABLE 95. RED HAT, INC: RECENT DEVELOPMENTS
TABLE 96. CA TECHNOLOGIES: FINANCIALS
TABLE 97. CA TECHNOLOGIES: SERVICES & SERVICES
TABLE 98. CA TECHNOLOGIES: RECENT DEVELOPMENTS
TABLE 99. DOCKER INC: FINANCIALS
TABLE 100. DOCKER INC: SERVICES & SERVICES
TABLE 101. DOCKER INC: RECENT DEVELOPMENTS
TABLE 102. GOOGLE, INC: FINANCIALS
TABLE 103. GOOGLE, INC: SERVICES & SERVICES
TABLE 104. GOOGLE, INC: RECENT DEVELOPMENTS
TABLE 105. IBM CORPORATION: FINANCIALS
TABLE 106. IBM CORPORATION: SERVICES & SERVICES
TABLE 107. IBM CORPORATION: RECENT DEVELOPMENTS
TABLE 108. JOYENT, INC: FINANCIALS
TABLE 109. JOYENT, INC: SERVICES & SERVICES
TABLE 110. JOYENT, INC: RECENT DEVELOPMENTS
TABLE 111. MESOSPHERE, INC: FINANCIALS
TABLE 112. MESOSPHERE, INC: SERVICES & SERVICES
TABLE 113. MESOSPHERE, INC: RECENT DEVELOPMENTS
TABLE 114. MICROSOFT CORPORATION: FINANCIALS
TABLE 115. MICROSOFT CORPORATION: SERVICES & SERVICES
TABLE 116. MICROSOFT CORPORATION: RECENT DEVELOPMENTS
Research Framework
Infoholic Research works on a holistic 360° approach in order to deliver high quality, validated and reliable information in our market reports. The Market estimation and forecasting involves following steps:
- Data Collation (Primary & Secondary)
- In-house Estimation (Based on proprietary data bases and Models)
- Market Triangulation
- Forecasting

Market related information is congregated from both primary and secondary sources.
Primary sources
Involved participants from all global stakeholders such as Solution providers, service providers, Industry associations, thought leaders etc. across levels such as CXOs, VPs and managers. Plus, our in-house industry experts having decades of industry experience contribute their consulting and advisory services.
Secondary sources
Include public sources such as regulatory frameworks, government IT spending, government demographic indicators, industry association statistics, and company publications along with paid sources such as Factiva, OneSource, Bloomberg among others.
![]()


