
Apheresis Market By Product Type (Devices and Disposables), Application (Plasmapheresis, Plateletpheresis, Erythrocytapheresis, Leukapheresis, Photopheresis), Technology (Membrane Filtration, Centrifugation), Method (Donor and Therapeutic Apheresis), and Region (North America, Asia Pacific and Rest of World) – Global Forecast up to 2026
- July, 2020
- Domain: Healthcare - Medical Devices
- Get Free 10% Customization in this Report
Apheresis is a medical procedure which deals with removing the blood from the body of patient or donor, for separating some required individual components from it while simultaneously re-introducing the remaining blood into the body of the donor or patient.
Research Methodology:
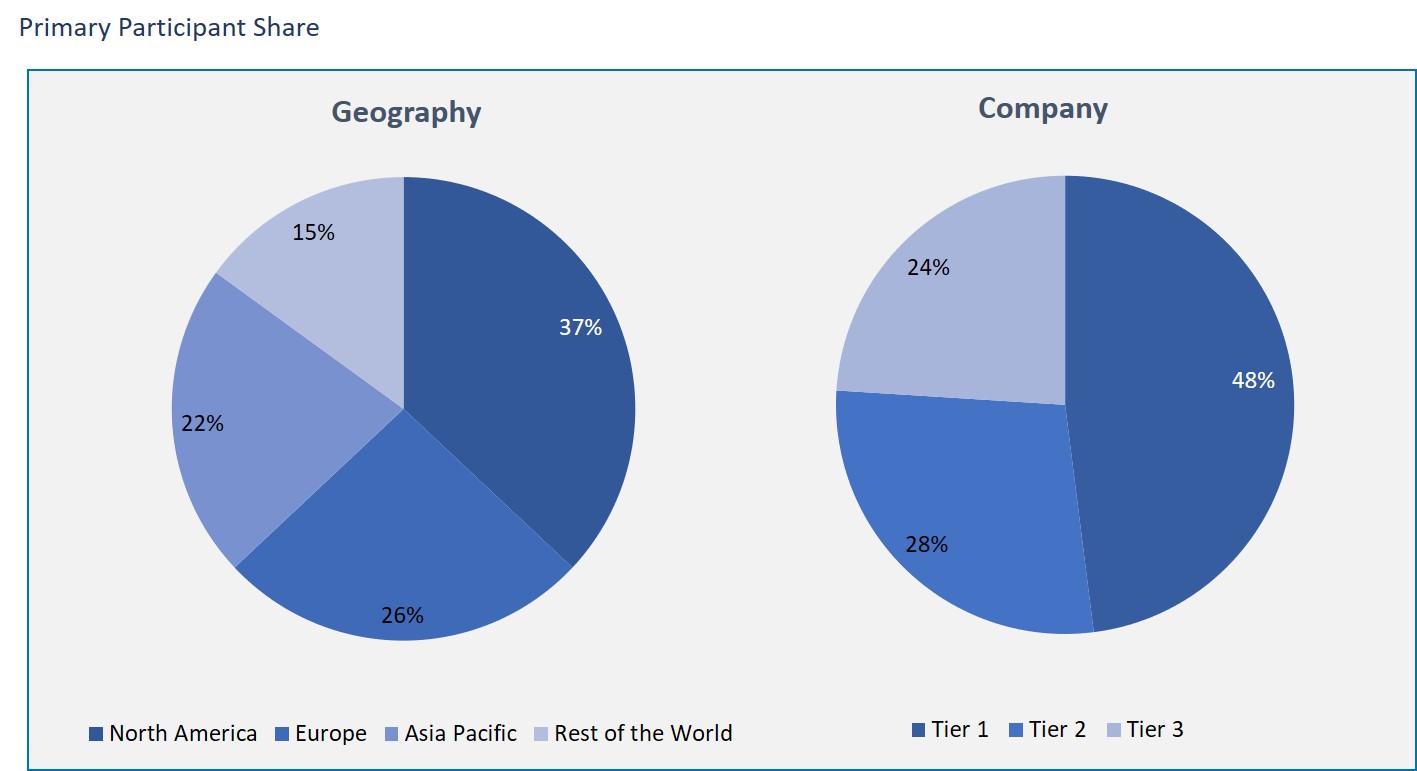
The apheresis market has been analyzed by utilizing the optimum combination of secondary sources and in-house methodology, along with an irreplaceable blend of primary insights. The real-time assessment of the market is an integral part of our market sizing and forecasting methodology. Our industry experts and panel of primary participants have helped in compiling relevant aspects with realistic parametric estimations for a comprehensive study. The participation share of different categories of primary participants is given below:
The apheresis market is expected to grow at a CAGR of ~7.7% during the forecast period 2019–2026. The expansion of this market can be attributed to the rise in the prevalence of chronic diseases, increase in the surgical procedures and the growing cases of accident or injury. However, the market is constrained by the high cost of its procedures, lack of skilled professionals and its awareness especially in the under- developed countries. The ongoing pandemic duly points out to the dire need of investment in the healthcare sector. The treatment by the transfusion with convalescent plasma has resurfaced to fight this deadly disease due to its potential merits. There is an empirical data available on its benefits and the high potential of this method in the health industry.
The scope of Apheresis market is defined by products devices, applications, procedure, technology, and region. The following report closely analyses this trend in this market by capturing details of the investment, growth opportunities, and government initiatives in the upcoming years. The focus is also on some key challenges and their impact on the market. Therefore, it is a useful tool for the key stakeholders study this market comprehensively.
Based on product, the apheresis market is divided into:
- Devices
- Disposables
Disposables had the higher market share in 2019 and are anticipated to maintain this throughout the forecast period because of substantial progress in the manufacturing of blood bags, tubing sets, filters, kits and various instruments and separators. The market of apheresis devices is growing consistently but at a relatively slower rate. There has been increasing efficiency in the ability to separate all types of blood components through therapeutics procedure.
Application used in apheresis includes:
- Plasmapheresis
- Plateletpheresis
- Erythrocytapheresis
- Leukapheresis
- Photopheresis
Plasmapheresis which is a process to separate plasma, white blood cells, red blood cells and platelets, had the largest share in the market in 2019 due to the rise in blood-related disorders and growing demand for plasma- derived medicines.
On the basis of technology, it can be categorized under
- Membrane Filtration
- Centrifugation
These machine functions are used to separate various blood components. Membrane filters are useful in filtration of plasma from other components such as white blood cells, red blood cells and platelets However, in centrifugation, specific cells are separated by the use of gravity. This method is less time consuming and is highly used in Western European regions and Japan. In 2019, it produced maximum revenues in Apheresis market majorly due to its maximum use in hospitals.
On the basis of methods, the market is divided into:
- Automated Blood Collection
- Therapeutic Apheresis
It is done by extracting individual components such as platelets or plasma from the blood of the donor. In therapy, the purpose is to remove the defective disease-causing cells from the body of the patient. The rising instances of cardiovascular and neurological diseases, blood cancer etc are key factors in the rise of apheresis markets.
Based on region, the market is divided among four key regions of:
- North America
- Europe
- Asia Pacific
- Rest of the World
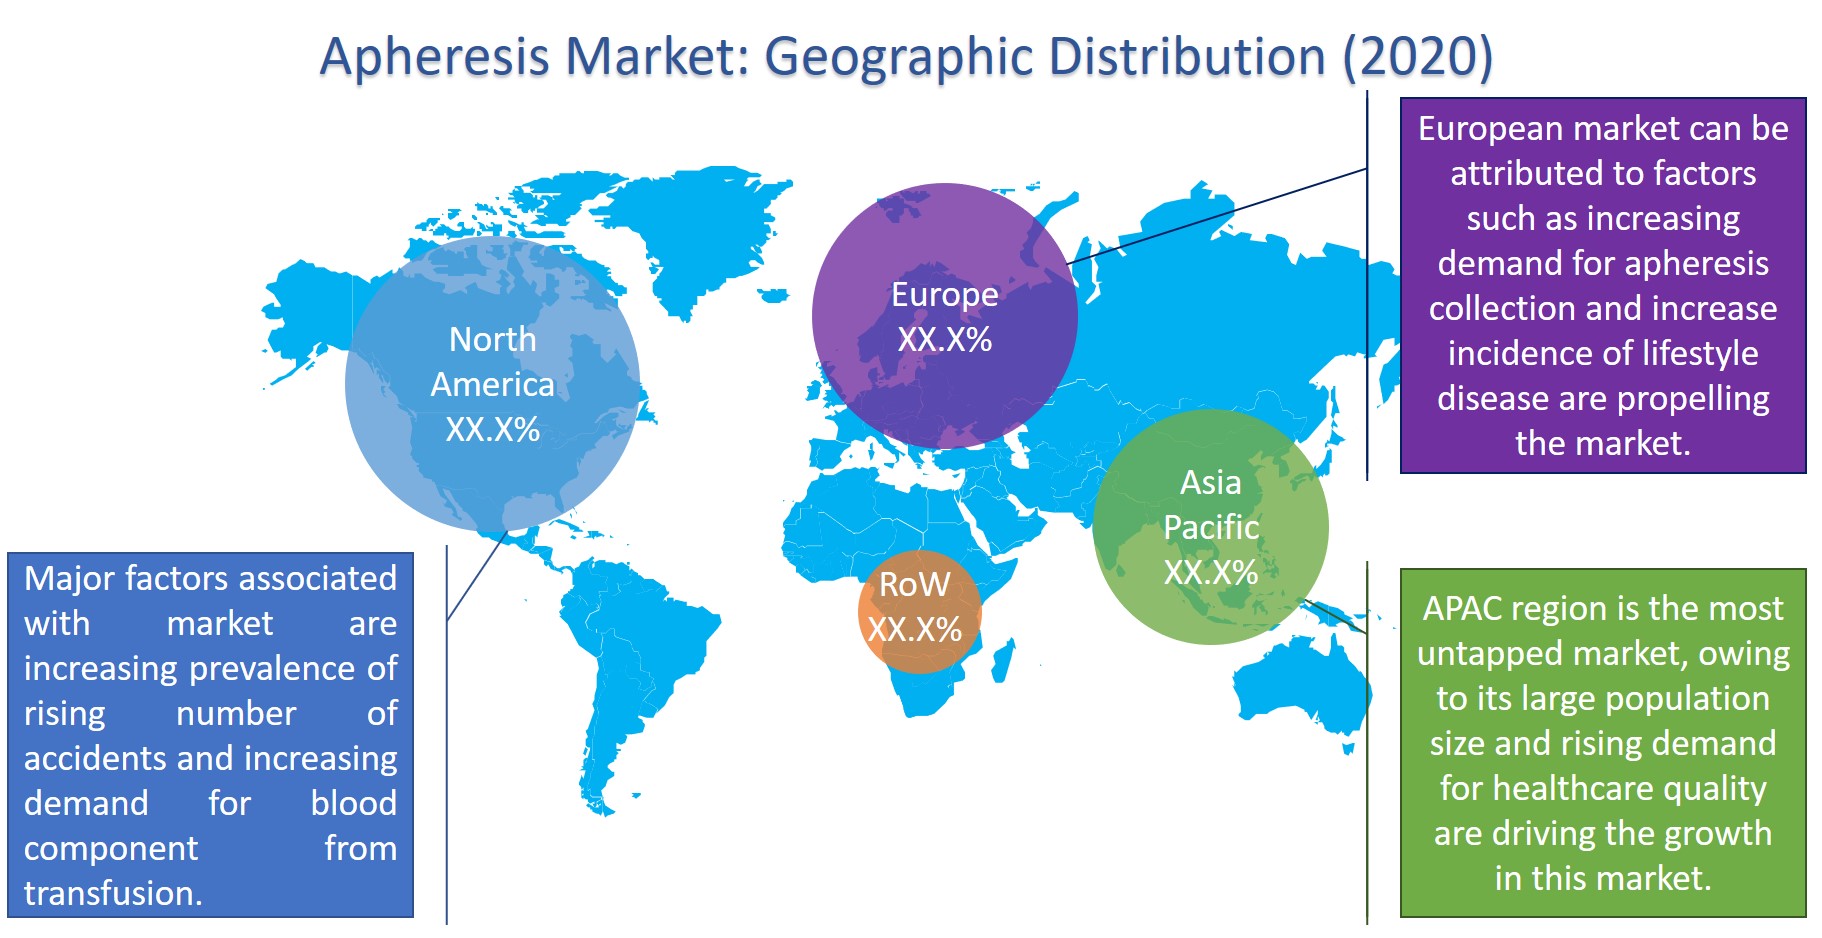
North America holds the largest share of the apheresis equipment market in as it has one of the world’s advanced healthcare facilities and high healthcare expenditure. The Asian Pacific regional market is expected to grow in the period due to the increase in the diseases requiring blood transfusion and the growing market and infrastructure for healthcare facilities. Also, the government expenditure on healthcare is expected to rise especially in India which aims at bringing it to 2.5 % in 2025.
However, there is much scope of improvement globally as the initial investment in this market is high and its maintenance cost is high. Nevertheless, we see the market is booming with key providers operating in the global apheresis market include:
- Kaneka Corporation
- LMB Technologie GmbH
- Medica S.p.a
- Miltenyi Biotec
The market is highly competitive due to advancing technology, various global government initiatives to generate knowledge, and various companies deploying strategies to commercialize their products.
- Executive Summary
- Industry Outlook
- Industry Overview
- Industry Trends
- Market Snapshot
- Market Definition
- Market Outlook
- PEST Analysis
- Porter Five Forces
- Related Markets
- Market Characterisitics
- Market Evolution
- Market Trends and Impact
- Advantages/Disadvantages of Market
- Regulatory Impact
- Market Offerings
- Market Segmentation
- Market Dynamics
- Drivers
- Restraints
- Opportunities
- DRO - Impact Analysis
- Product: Market Size & Analysis
- Overview
- Devices
- Disposables
- Application: Market Size & Analysis
- Overview
- Plasmapheresis
- Plateletpheresis
- Erythrocytapheresis
- Leukapheresis
- Photopheresis
- Technology: Market Size & Analysis
- Overview
- Membrane Filtration
- Centrifugation
- Method: Market Size & Analysis
- Overview
- Automated Blood Collection
- Therapeutic Apheresis
- Geography: Market Size & Analysis
- Overview
- North America
- Europe
- Asia Pacific
- Rest of the World
- Competitive Landscape
- Competitor Comparison Analysis
- Market Developments
- Mergers and Acquisitions, Legal, Awards, Partnerships
- Product Launches and execution
- Vendor Profiles
- Mallinckrodt Plc
- Overview
- Product Offerings
- Geographic Revenue
- Business Units
- Developments
- SWOT Analysis
- Business Strategy
- Medicap Clinic GmbH
- Overview
- Product Offerings
- Geographic Revenue
- Business Units
- Developments
- SWOT Analysis
- Business Strategy
- LMB Technologie GmbH
- Overview
- Product Offerings
- Geographic Revenue
- Business Units
- Developments
- SWOT Analysis
- Business Strategy
- Bioelettronica Srl
- Overview
- Product Offerings
- Geographic Revenue
- Business Units
- Developments
- SWOT Analysis
- Business Strategy
- Infomed
- Overview
- Product Offerings
- Geographic Revenue
- Business Units
- Developments
- SWOT Analysis
- Business Strategy
- B. Braun Melsungen AG
- Overview
- Product Offerings
- Geographic Revenue
- Business Units
- Developments
- SWOT Analysis
- Business Strategy
- Cerus Corporation
- Overview
- Product Offerings
- Geographic Revenue
- Business Units
- Developments
- SWOT Analysis
- Business Strategy
- Kaneka Corporation
- Overview
- Product Offerings
- Geographic Revenue
- Business Units
- Developments
- SWOT Analysis
- Business Strategy
- Kawasumi Laboratories, Inc.
- Overview
- Product Offerings
- Geographic Revenue
- Business Units
- Developments
- SWOT Analysis
- Business Strategy
- Nikkiso Co., Ltd.
- Overview
- Product Offerings
- Geographic Revenue
- Business Units
- Developments
- SWOT Analysis
- Business Strategy
- Mallinckrodt Plc
- Companies to Watch
- Macopharma SA
- Overview
- Market
- Business Strategy
- Miltenyi Biotec
- Overview
- Market
- Business Strategy
- Otsuka Holdings Co., Ltd.
- Overview
- Market
- Business Strategy
- Medica Spa
- Overview
- Market
- Business Strategy
- Cytosorbents Corporation
- Overview
- Market
- Business Strategy
- Toray Medical Co., Ltd.
- Overview
- Market
- Business Strategy
- Terumo BCT, Inc.
- Overview
- Market
- Business Strategy
- Fresenius Se & Co. KGaA
- Overview
- Market
- Business Strategy
- Haemonetics Corporation
- Overview
- Market
- Business Strategy
- Baxter International Inc.
- Overview
- Market
- Business Strategy
- Asahi Kasei Medical Co. Ltd
- Overview
- Market
- Business Strategy
- Macopharma SA
- Analyst Opinion
- Annexure
- Report Scope
- Market Definitions
- Research Methodology
- Data Collation and In-house Estimation
- Market Triangulation
- Forecasting
- Report Assumptions
- Declarations
- Stakeholders
- Abbreviations
TABLE 1. GLOBAL APHERESIS MARKET VALUE, BY PRODUCT, 2020-2026 (USD BILLION)
TABLE 2. GLOBAL APHERESIS MARKET VALUE FOR DEVICES, BY GEOGRAPHY, 2020-2026 (USD
BILLION)
TABLE 3. GLOBAL APHERESIS MARKET VALUE FOR DISPOSABLES, BY GEOGRAPHY, 2020-2026 (USD
BILLION)
TABLE 4. GLOBAL APHERESIS MARKET VALUE, BY APPLICATION, 2020-2026 (USD BILLION)
TABLE 5. GLOBAL APHERESIS MARKET VALUE FOR PLASMAPHERESIS, BY GEOGRAPHY, 2020-2026
(USD BILLION)
TABLE 6. GLOBAL APHERESIS MARKET VALUE FOR PLATELETPHERESIS, BY GEOGRAPHY, 2020-2026
(USD BILLION)
TABLE 7. GLOBAL APHERESIS MARKET VALUE FOR ERYTHROCYTAPHERESIS, BY GEOGRAPHY, 2020-
2026 (USD BILLION)
TABLE 8. GLOBAL APHERESIS MARKET VALUE FOR LEUKAPHERESIS, BY GEOGRAPHY, 2020-2026 (USD
BILLION)
TABLE 9. GLOBAL APHERESIS MARKET VALUE FOR PHOTOPHERESIS, BY GEOGRAPHY, 2020-2026
(USD BILLION)
TABLE 10. GLOBAL APHERESIS MARKET VALUE, BY TECHNOLOGY, 2020-2026 (USD BILLION)
TABLE 11. GLOBAL APHERESIS MARKET VALUE FOR MEMBRANE FILTRATION, BY GEOGRAPHY, 2020-
2026 (USD BILLION)
TABLE 12. GLOBAL APHERESIS MARKET VALUE FOR CENTRIFUGATION, BY GEOGRAPHY, 2020-2026
(USD BILLION)
TABLE 13. GLOBAL APHERESIS MARKET VALUE, BY METHOD, 2020-2026 (USD BILLION)
TABLE 14. GLOBAL APHERESIS MARKET VALUE FOR AUTOMATED BLOOD COLLECTION, BY GEOGRAPHY,
2020-2026 (USD BILLION)
TABLE 15. GLOBAL APHERESIS MARKET VALUE FOR THERAPEUTIC APHERESIS, BY GEOGRAPHY, 2020-
2026 (USD BILLION)
TABLE 16. NORTH AMERICA APHERESIS MARKET VALUE, BY PRODUCT, 2020-2026 (USD BILLION)
TABLE 17. NORTH AMERICA APHERESIS MARKET VALUE FOR DEVICES, BY GEOGRAPHY, 2020-2026
(USD BILLION)
TABLE 18. NORTH AMERICA APHERESIS MARKET VALUE FOR DISPOSABLES, BY GEOGRAPHY, 2020-
2026 (USD BILLION)
TABLE 19. NORTH AMERICA APHERESIS MARKET VALUE, BY APPLICATION, 2020-2026 (USD BILLION)
TABLE 20. NORTH AMERICA APHERESIS MARKET VALUE FOR PLASMAPHERESIS, BY GEOGRAPHY, 2020-
2026 (USD BILLION)
TABLE 21. NORTH AMERICA APHERESIS MARKET VALUE FOR PLATELETPHERESIS, BY GEOGRAPHY,
2020-2026 (USD BILLION)
TABLE 22. NORTH AMERICA APHERESIS MARKET VALUE FOR ERYTHROCYTAPHERESIS, BY GEOGRAPHY,
2020-2026 (USD BILLION)
TABLE 23. NORTH AMERICA APHERESIS MARKET VALUE FOR LEUKAPHERESIS, BY GEOGRAPHY, 2020-
2026 (USD BILLION)
TABLE 24. NORTH AMERICA APHERESIS MARKET VALUE FOR PHOTOPHERESIS, BY GEOGRAPHY, 2020-
2026 (USD BILLION)
TABLE 25. NORTH AMERICA APHERESIS MARKET VALUE, BY TECHNOLOGY, 2020-2026 (USD BILLION)
TABLE 26. NORTH AMERICA APHERESIS MARKET VALUE FOR MEMBRANE FILTRATION, BY GEOGRAPHY,
2020-2026 (USD BILLION)
TABLE 27. NORTH AMERICA APHERESIS MARKET VALUE FOR CENTRIFUGATION, BY GEOGRAPHY, 2020-
2026 (USD BILLION)
TABLE 28. NORTH AMERICA APHERESIS MARKET VALUE, BY METHOD, 2020-2026 (USD BILLION)
TABLE 29. NORTH AMERICA APHERESIS MARKET VALUE FOR AUTOMATED BLOOD COLLECTION, BY
GEOGRAPHY, 2020-2026 (USD BILLION)
TABLE 30. NORTH AMERICA APHERESIS MARKET VALUE FOR THERAPEUTIC APHERESIS, BY
GEOGRAPHY, 2020-2026 (USD BILLION)
TABLE 31. EUROPE APHERESIS MARKET VALUE, BY PRODUCT, 2020-2026 (USD BILLION)
TABLE 32. EUROPE APHERESIS MARKET VALUE FOR DEVICES, BY GEOGRAPHY, 2020-2026 (USD
BILLION)
TABLE 33. EUROPE APHERESIS MARKET VALUE FOR DISPOSABLES, BY GEOGRAPHY, 2020-2026 (USD
BILLION)
TABLE 34. EUROPE APHERESIS MARKET VALUE, BY APPLICATION, 2020-2026 (USD BILLION)
TABLE 35. EUROPE APHERESIS MARKET VALUE FOR PLASMAPHERESIS, BY GEOGRAPHY, 2020-2026
(USD BILLION)
TABLE 36. EUROPE APHERESIS MARKET VALUE FOR PLATELETPHERESIS, BY GEOGRAPHY, 2020-2026
(USD BILLION)
TABLE 37. EUROPE APHERESIS MARKET VALUE FOR ERYTHROCYTAPHERESIS, BY GEOGRAPHY, 2020-
2026 (USD BILLION)
TABLE 38. EUROPE APHERESIS MARKET VALUE FOR LEUKAPHERESIS, BY GEOGRAPHY, 2020-2026 (USD
BILLION)
TABLE 39. EUROPE APHERESIS MARKET VALUE FOR PHOTOPHERESIS, BY GEOGRAPHY, 2020-2026
(USD BILLION)
TABLE 40. EUROPE APHERESIS MARKET VALUE, BY TECHNOLOGY, 2020-2026 (USD BILLION)
TABLE 41. EUROPE APHERESIS MARKET VALUE FOR MEMBRANE FILTRATION, BY GEOGRAPHY, 2020-
2026 (USD BILLION)
TABLE 42. EUROPE APHERESIS MARKET VALUE FOR CENTRIFUGATION, BY GEOGRAPHY, 2020-2026
(USD BILLION)
TABLE 43. EUROPE APHERESIS MARKET VALUE, BY METHOD, 2020-2026 (USD BILLION)
TABLE 44. EUROPE APHERESIS MARKET VALUE FOR AUTOMATED BLOOD COLLECTION, BY GEOGRAPHY,
2020-2026 (USD BILLION)
TABLE 45. EUROPE APHERESIS MARKET VALUE FOR THERAPEUTIC APHERESIS, BY GEOGRAPHY, 2020-
2026 (USD BILLION)
TABLE 46. ASIA PACIFIC APHERESIS MARKET VALUE, BY PRODUCT, 2020-2026 (USD BILLION)
TABLE 47. ASIA PACIFC APHERESIS MARKET VALUE FOR DEVICES, BY GEOGRAPHY, 2020-2026 (USD
BILLION)
TABLE 48. ASIA PACIFC APHERESIS MARKET VALUE FOR DISPOSABLES, BY GEOGRAPHY, 2020-2026
(USD BILLION)
TABLE 49. ASIA PACIFC APHERESIS MARKET VALUE, BY APPLICATION, 2020-2026 (USD BILLION)
TABLE 50. ASIA PACIFC APHERESIS MARKET VALUE FOR PLASMAPHERESIS, BY GEOGRAPHY, 2020-
2026 (USD BILLION)
TABLE 51. ASIA PACIFC APHERESIS MARKET VALUE FOR PLATELETPHERESIS, BY GEOGRAPHY, 2020-
2026 (USD BILLION)
TABLE 52. ASIA PACIFC APHERESIS MARKET VALUE FOR ERYTHROCYTAPHERESIS, BY GEOGRAPHY,
2020-2026 (USD BILLION)
TABLE 53. ASIA PACIFC APHERESIS MARKET VALUE FOR LEUKAPHERESIS, BY GEOGRAPHY, 2020-2026
(USD BILLION)
TABLE 54. ASIA PACIFC APHERESIS MARKET VALUE FOR PHOTOPHERESIS, BY GEOGRAPHY, 2020-2026
(USD BILLION)
TABLE 55. ASIA PACIFC APHERESIS MARKET VALUE, BY TECHNOLOGY, 2020-2026 (USD BILLION)
TABLE 56. ASIA PACIFC APHERESIS MARKET VALUE FOR MEMBRANE FILTRATION, BY GEOGRAPHY,
2020-2026 (USD BILLION)
TABLE 57. ASIA PACIFC APHERESIS MARKET VALUE FOR CENTRIFUGATION, BY GEOGRAPHY, 2020-2026
(USD BILLION)
TABLE 58. ASIA PACIFC APHERESIS MARKET VALUE, BY METHOD, 2020-2026 (USD BILLION)
TABLE 59. ASIA PACIFC APHERESIS MARKET VALUE FOR AUTOMATED BLOOD COLLECTION, BY
GEOGRAPHY, 2020-2026 (USD BILLION)
TABLE 60. ASIA PACIFC APHERESIS MARKET VALUE FOR THERAPEUTIC APHERESIS, BY GEOGRAPHY,
2020-2026 (USD BILLION)
TABLE 61. REST OF WORLD APHERESIS MARKET VALUE, BY PRODUCT, 2020-2026 (USD BILLION)
TABLE 62. REST OF WORLD APHERESIS MARKET VALUE FOR DEVICES, BY GEOGRAPHY, 2020-2026
(USD BILLION)
TABLE 63. REST OF WORLD APHERESIS MARKET VALUE FOR DISPOSABLES, BY GEOGRAPHY, 2020-
2026 (USD BILLION)
TABLE 64. REST OF WORLD APHERESIS MARKET VALUE, BY APPLICATION, 2020-2026 (USD BILLION)
TABLE 65. REST OF WORLD APHERESIS MARKET VALUE FOR PLASMAPHERESIS, BY GEOGRAPHY, 2020-
2026 (USD BILLION)
TABLE 66. REST OF WORLD APHERESIS MARKET VALUE FOR PLATELETPHERESIS, BY GEOGRAPHY,
2020-2026 (USD BILLION)
TABLE 67. REST OF WORLD APHERESIS MARKET VALUE FOR ERYTHROCYTAPHERESIS, BY GEOGRAPHY,
2020-2026 (USD BILLION)
TABLE 68. REST OF WORLD APHERESIS MARKET VALUE FOR LEUKAPHERESIS, BY GEOGRAPHY, 2020-
2026 (USD BILLION)
TABLE 69. REST OF WORLD APHERESIS MARKET VALUE FOR PHOTOPHERESIS, BY GEOGRAPHY, 2020-
2026 (USD BILLION)
TABLE 70. REST OF WORLD APHERESIS MARKET VALUE, BY TECHNOLOGY, 2020-2026 (USD BILLION)
TABLE 71. REST OF WORLD APHERESIS MARKET VALUE FOR MEMBRANE FILTRATION, BY GEOGRAPHY,
2020-2026 (USD BILLION)
TABLE 72. REST OF WORLD APHERESIS MARKET VALUE FOR CENTRIFUGATION, BY GEOGRAPHY, 2020-
2026 (USD BILLION)
TABLE 73. REST OF WORLD APHERESIS MARKET VALUE, BY METHOD, 2020-2026 (USD BILLION)
TABLE 74. REST OF WORLD APHERESIS MARKET VALUE FOR AUTOMATED BLOOD COLLECTION, BY
GEOGRAPHY, 2020-2026 (USD BILLION)
TABLE 75. REST OF WORLD APHERESIS MARKET VALUE FOR THERAPEUTIC APHERESIS, BY
GEOGRAPHY, 2020-2026 (USD BILLION)
TABLE 76. MALLINCKRODT PLC: OVERVIEW
TABLE 77. MALLINCKRODT PLC: STRATEGIC SNAPSHOT
TABLE 78. MALLINCKRODT PLC: BUSINESS OPPORTUNITIES AND OUTLOOK
TABLE 79. MALLINCKRODT PLC: PRODUCT/SERVICE PORTFOLIO
TABLE 80. MEDICAP CLINIC GMBH: OVERVIEW
TABLE 81. MEDICAP CLINIC GMBH: STRATEGIC SNAPSHOT
TABLE 82. MEDICAP CLINIC GMBH: BUSINESS OPPORTUNITIES AND OUTLOOK
TABLE 83. MEDICAP CLINIC GMBH: PRODUCT/SERVICE PORTFOLIO
TABLE 84. LMB TECHNOLOGIE GMBH: OVERVIEW
TABLE 85. LMB TECHNOLOGIE GMBH: STRATEGIC SNAPSHOT
TABLE 86. LMB TECHNOLOGIE GMBH: BUSINESS OPPORTUNITIES AND OUTLOOK
TABLE 87. LMB TECHNOLOGIE GMBH: PRODUCT/SERVICE PORTFOLIO
TABLE 88. BIOELETTRONICA SRL: OVERVIEW
TABLE 89. BIOELETTRONICA SRL: STRATEGIC SNAPSHOT
TABLE 90. BIOELETTRONICA SRL: BUSINESS OPPORTUNITIES AND OUTLOOK
TABLE 91. BIOELETTRONICA SRL: PRODUCT/SERVICE PORTFOLIO
TABLE 92. INFOMED: OVERVIEW
TABLE 93. INFOMED: STRATEGIC SNAPSHOT
TABLE 94. INFOMED: BUSINESS OPPORTUNITIES AND OUTLOOK
TABLE 95. INFOMED: PRODUCT/SERVICE PORTFOLIO
TABLE 96. B. BRAUN MELSUNGEN AG: OVERVIEW
TABLE 97. B. BRAUN MELSUNGEN AG: STRATEGIC SNAPSHOT
TABLE 98. B. BRAUN MELSUNGEN AG: BUSINESS OPPORTUNITIES AND OUTLOOK
TABLE 99. B. BRAUN MELSUNGEN AG: PRODUCT/SERVICE PORTFOLIO
TABLE 100. CERUS CORPORATION: OVERVIEW
TABLE 101. CERUS CORPORATION: STRATEGIC SNAPSHOT
TABLE 102. CERUS CORPORATION: BUSINESS OPPORTUNITIES AND OUTLOOK
TABLE 103. CERUS CORPORATION: PRODUCT/SERVICE PORTFOLIO
TABLE 104. KANEKA CORPORATION: OVERVIEW
TABLE 105. KANEKA CORPORATION: STRATEGIC SNAPSHOT
TABLE 106. KANEKA CORPORATION: BUSINESS OPPORTUNITIES AND OUTLOOK
TABLE 107. KANEKA CORPORATION: PRODUCT/SERVICE PORTFOLIO
TABLE 108. KAWASUMI LABORATORIES, INC: OVERVIEW
TABLE 109. KAWASUMI LABORATORIES, INC: STRATEGIC SNAPSHOT
TABLE 110. KAWASUMI LABORATORIES, INC: BUSINESS OPPORTUNITIES AND OUTLOOK
TABLE 111. KAWASUMI LABORATORIES, INC: PRODUCT/SERVICE PORTFOLIO
TABLE 112. NIKKISO CO., LTD: OVERVIEW
TABLE 113. NIKKISO CO., LTD: STRATEGIC SNAPSHOT
TABLE 114. NIKKISO CO., LTD: BUSINESS OPPORTUNITIES AND OUTLOOK
TABLE 115. NIKKISO CO., LTD: PRODUCT/SERVICE PORTFOLIO
Research Framework
Infoholic Research works on a holistic 360° approach in order to deliver high quality, validated and reliable information in our market reports. The Market estimation and forecasting involves following steps:
- Data Collation (Primary & Secondary)
- In-house Estimation (Based on proprietary data bases and Models)
- Market Triangulation
- Forecasting

Market related information is congregated from both primary and secondary sources.
Primary sources
Involved participants from all global stakeholders such as Solution providers, service providers, Industry associations, thought leaders etc. across levels such as CXOs, VPs and managers. Plus, our in-house industry experts having decades of industry experience contribute their consulting and advisory services.
Secondary sources
Include public sources such as regulatory frameworks, government IT spending, government demographic indicators, industry association statistics, and company publications along with paid sources such as Factiva, OneSource, Bloomberg among others.
![]()


