
Ambulatory Surgery Centers Market by Product (Clinical It Solutions, Non-Clinical Healthcare It Solutions, And HCIT Outsourcing Services), By Component (Services, Software, and Hardware), By Specialty Type (Single, Multi-specialty), and By Geography – Global Drivers, Restraints, Opportunities, Trends, and Forecast up to 2026
- August, 2020
- Domain: Healthcare - Health and Hygiene
- Get Free 10% Customization in this Report
An ambulatory surgery center is defined as a unique entity that primarily provides outpatient procedures to those types of patients who do not require an overnight stay after the surgery. ASCs are outpatient surgery centers where surgeries are performed on the same day of admission of patients without any kind of need for an overnight stay. In addition to the ASCs, hospital outpatient departments (HOPDs) also perform outpatient surgical procedures. These centers offer all diagnostic and preventive procedures. The ambulatory surgical centers are highly efficient, and they perform same-day surgeries such as gall bladder removal, small join repair cataract surgery, abdominal hernia repair, skin therapy, and others.
Research Methodology:
The estimated market value of Ambulatory Surgery Centers in 2020 is $2.29 billion. There are three important factors which are the driving wheels behind the growth of Ambulatory Surgical Centers market:
- A rising number of Ambulatory Surgical Centers
- An absolute need to curtail escalating healthcare costs
- Availability of minimally invasive treatment
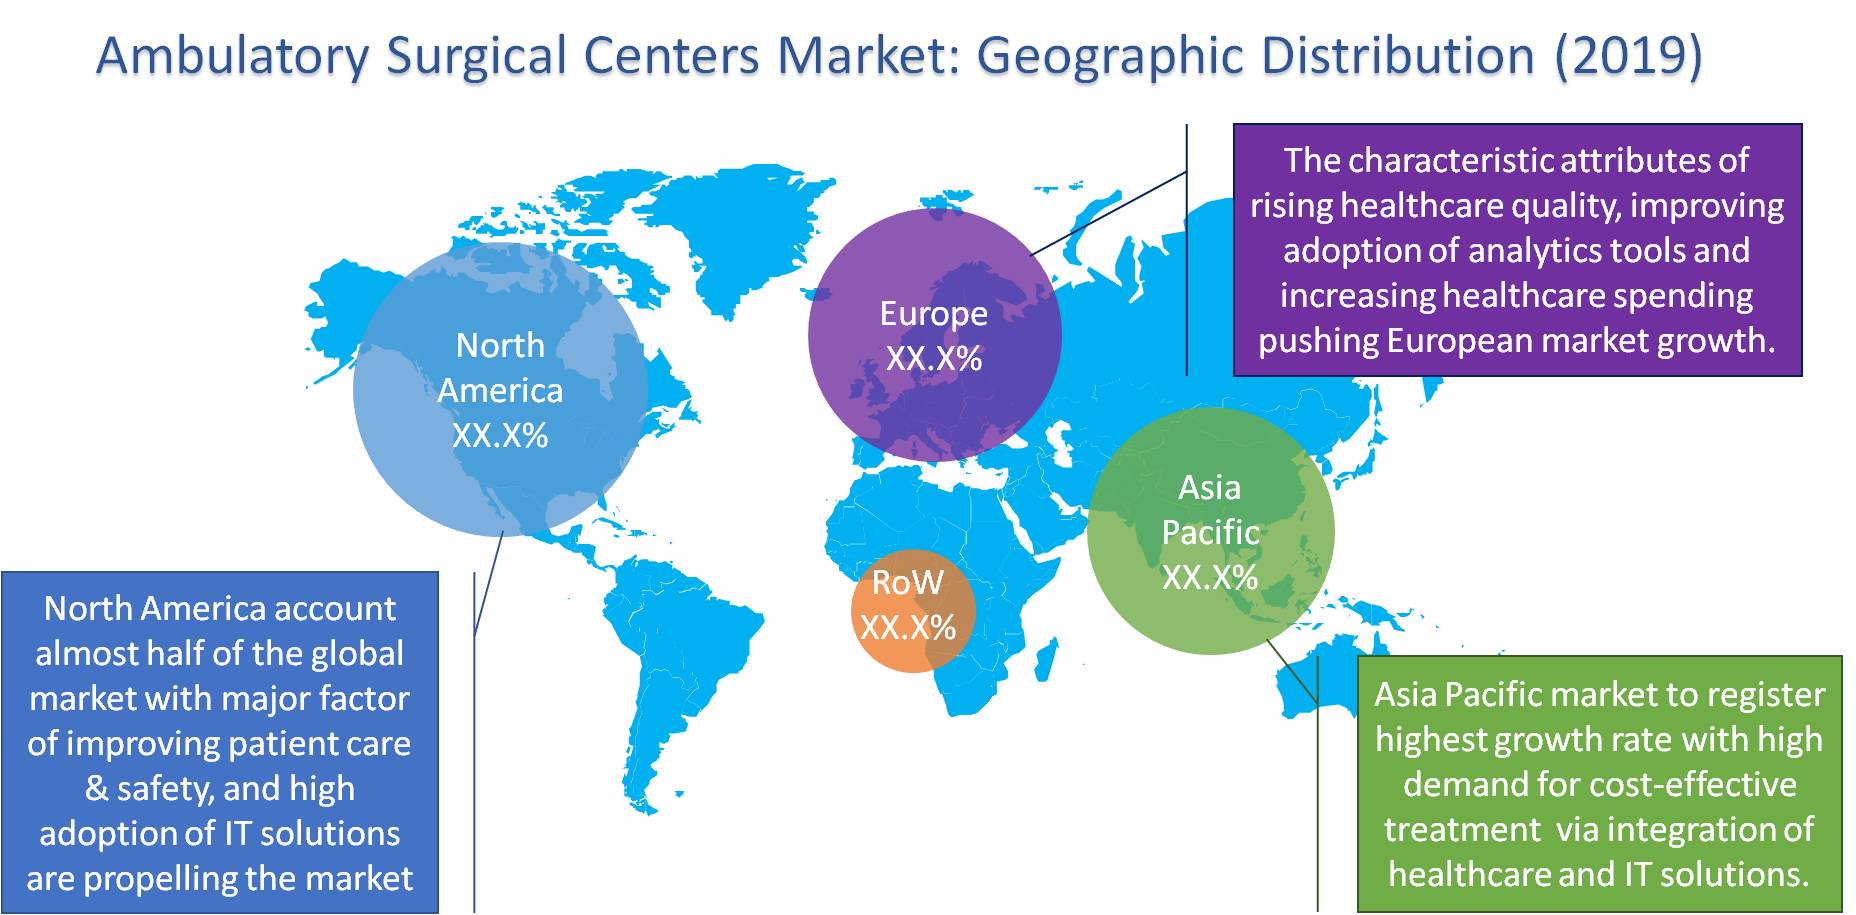
Growth in the global ambulatory surgical centers market is largely a result of growing focus on confinement of healthcare costs and increased healthcare spending on ASCs. ASCs are primarily focused on increasing the number of facilities and types of procedures performed. An increasing variety of procedures provided by ASCs with greater reimbursement benefits are fuelling market growth. Across worldwide, ASCs are continuously making attempts to extend their range of services to increase patient served and thereby increasing its revenues. The growth of procedures in ASC is likely to beat hospital outpatient surgical growth.
Innovative and technology advances increment the methodology that can be securely performed on outpatient treatment. For orthopedic specialists, ASCs are regularly increasingly helpful, progressively proficient, and adaptable to their necessities. Numerous musculoskeletal methodologies are profoundly specialized and concentrated, and ASCs permit an orthopedic specialist the chance to perform out these perplexing techniques more proficiently than other types of treatment methods. In the US, there are fewer freestanding surgery centers being built, while more centers have been built within a larger premise that offers a wider array of ambulatory care services. ASCs are being opened within such facilities which drive the market growth
The market of Ambulatory surgical centers is segmented into three types:
- Services
- Software
- Hardware
With the introduction of complex software, the services need for integration and interoperability of software has increased, pushing the services segment for the larger market share in 2019. There has been a growing demand for outsourcing of various healthcare processes, which increases the demand for healthcare services management services.
Analyzing based on specialty, the Ambulatory surgical centers market is divided into
- Single Specality
- Multi Specality
In 2019, the multi-specialty segment of ASCs accounted for the largest share. The large share of multi-specialty can be accounted for the multiple numbers of surgical procedures that are carried out in these facilities and the presence of reimbursement for these procedures.
Analyzing on the basis of product, the Ambulatory surgical centers market is divided into
- Clinical It Solutions
- EHR
- Practice Management Software
- Medical Image Analysis
- E-Prescribing
- Telehealth Solutions
- Surgical Planning Software
- Health Integration Solution
- Population Health Management Solution
- Other Clinical Solutions
- Non-Clinical Healthcare IT Solutions
- Revenue Cycle Management
- Supply Chain Management Solutions
- Healthcare Anaytics Solutions
- Healthcare Interoperability Solutions
- Healthcare Quality Management Solutions
- Other Non-Clinincal Solutions
- HCIT Outsourcing Services
The factors which are the drivers of the market growth of ambulatory surgical centers are an increase in the number of surgeries, a rise in the incidence of chronic diseases, and growth in the geriatric population. In addition to the above-mentioned factors, the advancements in technology, and surging demand for minimally invasive surgeries are fuelling the growth of the ambulatory surgical Centre market. This domain is believed to have a dynamic and very cautious nature.
Few major players in the domain of Ambulatory Surgical Centers are McKesson Corporation, Cerner Corporation, GE Healthcare, Philips Healthcare, Allscripts Healthcare Solutions, Inc., Optum, Epic Systems Corporation, Advanced Data Systems Corporation, Epic Systems Corporation, NextGen Healthcare, CureMD, HST Pathways, and Surgical Information Systems.
The growing burden of cutting down of increasing healthcare costs, move from inpatient to outpatient surgical procedures, and rising need of IT solutions such as mhealth, telehealth, and remote monitoring of the patient for better management create the market opportunity for Ambulatory Surgical Centers vendors to fulfill both the residential as well as commercial demand
The above report will help in understanding the current market dynamics, changing needs, and innovations that would be required to augment the user experience.
- A quantitative analysis would be provided which would help the stakeholders while they decide to capitalize on the present market opportunities
- This extensive report would be the foundation for any research institute on the Ambulatory Surgical Centers, vendor capabilities, SWOT of the Ambulatory Surgical Centers and framework for data analysis for further advanced innovation
- This report briefly describes the factors which are driving the growth of Ambulatory Surgical Centers and the factors which are restricting the progress
- The key players of this market have been recognized, and then a competitive outlook has been prepared.
- The report contains insight regarding technological innovations and advanced solutions for the Ambulatory Surgical Centers
1. Executive Summary
2. Industry Outlook
2.1. Industry Overview
2.2. Industry Trends
3. Market Snapshot
3.1. Market Definition
3.2. Market Outlook
3.3. PEST Analysis
3.4. Porter Five Forces
3.5. Related Markets
4. Market Characterisitics
4.1. Market Evolution
4.2. Market Trends and Impact
4.3. Advantages/Disadvantages of Market
4.4. Regulatory Impact
4.5. Market Offerings
4.6. Market Segmentation
4.7. Market Dynamics
4.7.1. Drivers
4.7.2. Restraints
4.7.3. Opportunities
4.8. DRO - Impact Analysis
5. Products & services: Market Size & Analysis
5.1. Overview
5.2. Hcit Outsourcing Services
5.2.1. Population Health Management Solutions
5.2.2. Medical Image Analysis Solutions
5.2.3. e-prescribing Solutions
5.2.4. Practice Management Software
5.2.5. Surgical Planning Software
5.2.6. Telehealth Solutions
5.2.7. Healthcare Integration Solutions
5.2.8. Other Clinical Solutions
5.3. Non-Clinical Healthcare It Solutions
5.3.1. Revenue Cycle Management Solutions
5.3.2. Healthcare Analytics Solutions
5.3.3. Healthcare Quality Management Solutions
5.3.4. Healthcare Interoperability Solutions
5.3.5. Other Non-clinical Solutions
5.3.6. Other
6. Components: Market Size & Analysis
6.1. Overview
6.2. Services
6.3. Software
6.4. Hardware
7. Specialty: Market Size & Analysis
7.1. Overview
7.2. Single Specialty
7.3. Multi-specialty
8. Geography: Market Size & Analysis
8.1. Overview
8.2. North America
8.3. Europe
8.4. Asia Pacific
8.5. Rest of the World
9. Competitive Landscape
9.1. Competitor Comparison Analysis
9.2. Market Developments
9.2.1. Mergers and Acquisitions, Legal, Awards, Partnerships
9.2.2. Product Launches and execution
10. Vendor Profiles
10.1. Cerner Corporation
10.1.1. Overview
10.1.2. Product Offerings
10.1.3. Geographic Revenue
10.1.4. Business Units
10.1.5. Developments
10.1.6. Business Strategy
10.2. Allscripts Healthcare Solutions, Inc
10.2.1. Overview
10.2.2. Product Offerings
10.2.3. Geographic Revenue
10.2.4. Business Units
10.2.5. Developments
10.2.6. Business Strategy
10.3. Mckesson Corporation
10.3.1. Overview
10.3.2. Product Offerings
10.3.3. Geographic Revenue
10.3.4. Business Units
10.3.5. Developments
10.3.6. Business Strategy
10.4. Nextgen Healthcare
10.4.1. Overview
10.4.2. Product Offerings
10.4.3. Geographic Revenue
10.4.4. Business Units
10.4.5. Developments
10.4.6. Business Strategy
10.5. Epic Systems Corporation
10.5.1. Overview
10.5.2. Product Offerings
10.5.3. Geographic Revenue
10.5.4. Business Units
10.5.5. Developments
10.5.6. Business Strategy
10.6. Philips Healthcare
10.6.1. Overview
10.6.2. Product Offerings
10.6.3. Geographic Revenue
10.6.4. Business Units
10.6.5. Developments
10.6.6. Business Strategy
10.7. GE HEALTHCARE
10.7.1. Overview
10.7.2. Product Offerings
10.7.3. Geographic Revenue
10.7.4. Business Units
10.7.5. Developments
10.7.6. Business Strategy
10.8. Medical Information Technology, Inc
10.8.1. Overview
10.8.2. Product Offerings
10.8.3. Geographic Revenue
10.8.4. Business Units
10.8.5. Developments
10.8.6. Business Strategy
10.9. ECLINICAL WORKS
10.9.1. Overview
10.9.2. Product Offerings
10.9.3. Geographic Revenue
10.9.4. Business Units
10.9.5. Developments
10.9.6. Business Strategy
10.10. Novus International, Inc
10.10.1. Overview
10.10.2. Product Offerings
10.10.3. Geographic Revenue
10.10.4. Business Units
10.10.5. Developments
10.10.6. Business Strategy
11. Companies to Watch
11.1. Advanced Data Systems Corporation
11.1.1. Overview
11.1.2. Market
11.1.3. Business Strategy
11.2. OPTUM
11.2.1. Overview
11.2.2. Market
11.2.3. Business Strategy
11.3. CUREMD
11.3.1. Overview
11.3.2. Market
11.3.3. Business Strategy
11.4. HST PATHWAYS
11.4.1. Overview
11.4.2. Market
11.4.3. Business Strategy
11.5. SURGICAL INFORMATION SYSTEMS, LLC
11.5.1. Overview
11.5.2. Market
11.5.3. Business Strategy
11.6. WRS HEALTH
11.6.1. Overview
11.6.2. Market
11.6.3. Business Strategy
11.7. DAVLONG BUSINESS SOLUTIONS
11.7.1. Overview
11.7.2. Market
11.7.3. Business Strategy
11.8. COMPULINK HEALTHCARE SOLUTIONS
11.8.1. Overview
11.8.2. Market
11.8.3. Business Strategy
11.9. AMBLITEL
11.9.1. Overview
11.9.2. Market
11.9.3. Business Strategy
11.10. DRCHRONO
11.10.1. Overview
11.10.2. Market
11.10.3. Business Strategy
12. Analyst Opinion
13. Annexure
14. Annexure
14.1. Report Scope
14.2. Market Definitions
14.3. Research Methodology
14.3.1. Data Collation and In-house Estimation
14.3.2. Market Triangulation
14.3.3. Forecasting
14.4. Report Assumptions
14.5. Declarations
14.6. Stakeholders
14.7. Abbreviation
TABLE 1. GLOBAL AMBULATORY SURGICAL CENTERS MARKET VALUE, BY PRODUCTS & SERVICES, 2020-2026 (USD MILLION)
TABLE 2. GLOBAL AMBULATORY SURGICAL CENTERS MARKET VALUE FOR HCIT OUTSOURCING SERVICES, BY GEOGRAPHY, 2020-2026 (USD MILLION)
TABLE 3. GLOBAL AMBULATORY SURGICAL CENTERS MARKET VALUE FOR NON-CLINICAL HEALTHCARE IT SOLUTIONS, BY GEOGRAPHY, 2020-2026 (USD MILLION)
TABLE 4. GLOBAL AMBULATORY SURGICAL CENTERS MARKET VALUE FOR REVENUE CYCLE MANAGEMENT SOLUTIONS, BY GEOGRAPHY, 2020-2026 (USD MILLION)
TABLE 5. GLOBAL AMBULATORY SURGICAL CENTERS MARKET VALUE FOR HEALTHCARE ANALYTICS SOLUTIONS, BY GEOGRAPHY, 2020-2026 (USD MILLION)
TABLE 6. GLOBAL AMBULATORY SURGICAL CENTERS MARKET VALUE, BY HEALTHCARE QUALITY MANAGEMENT SOLUTIONS, 2020-2026 (USD MILLION)
TABLE 7. GLOBAL AMBULATORY SURGICAL CENTERS MARKET VALUE FOR HEALTHCARE INTEROPERABILITY SOLUTIONS, BY GEOGRAPHY, 2020-2026 (USD MILLION)
TABLE 8. GLOBAL AMBULATORY SURGICAL CENTERS MARKET VALUE FOR OTHER NON-CLINICAL SOLUTIONS, BY GEOGRAPHY, 2020-2026 (USD MILLION)
TABLE 9. GLOBAL AMBULATORY SURGICAL CENTERS MARKET VALUE FOR POPULATION HEALTH MANAGEMENT SOLUTIONS, BY GEOGRAPHY, 2020-2026 (USD MILLION)
TABLE 10. GLOBAL AMBULATORY SURGICAL CENTERS MARKET VALUE FOR MEDICAL IMAGE ANALYSIS SOLUTIONS, BY GEOGRAPHY, 2020-2026 (USD MILLION)
TABLE 11. GLOBAL AMBULATORY SURGICAL CENTERS MARKET VALUE FOR E-PRESCRIBING SOLUTIONS, BY GEOGRAPHY, 2020-2026 (USD MILLION)
TABLE 12. GLOBAL AMBULATORY SURGICAL CENTERS MARKET VALUE FOR PRACTICE MANAGEMNET SOFTWARE, BY GEOGRAPHY, 2020-2026 (USD MILLION)
TABLE 13. GLOBAL AMBULATORY SURGICAL CENTERS MARKET VALUE FOR SURGICAL PLANNING SOFTWARE, BY GEOGRAPHY, 2020-2026 (USD MILLION)
TABLE 14. GLOBAL AMBULATORY SURGICAL CENTERS MARKET VALUE FOR TELEHEALTH SOLUTIONS, BY GEOGRAPHY, 2020-2026 (USD MILLION)
TABLE 15. GLOBAL AMBULATORY SURGICAL CENTERS MARKET VALUE FOR HEALTHCARE INTEGRATION SOLUTIONS, BY GEOGRAPHY, 2020-2026 (USD MILLION)
TABLE 16. GLOBAL AMBULATORY SURGICAL CENTERS MARKET VALUE, BY COMPONENTS, 2020-2026 (USD MILLION)
TABLE 17. GLOBAL AMBULATORY SURGICAL CENTERS MARKET VALUE FOR SERVICES, BY GEOGRAPHY, 2020-2026 (USD MILLION)
TABLE 18. GLOBAL AMBULATORY SURGICAL CENTERS MARKET VALUE FOR SOFTWARE, BY GEOGRAPHY, 2020-2026 (USD MILLION)
TABLE 19. GLOBAL AMBULATORY SURGICAL CENTERS MARKET VALUE FOR HARDWARE, BY GEOGRAPHY, 2020-2026 (USD MILLION)
TABLE 20. GLOBAL AMBULATORY SURGICAL CENTERS MARKET VALUE FOR SPECIALITY, BY GEOGRAPHY, 2020-2026 (USD MILLION)
TABLE 21. GLOBAL AMBULATORY SURGICAL CENTERS MARKET VALUE FOR SINGLE SPECIALTY, BY GEOGRAPHY, 2020-2026 (USD MILLION)
TABLE 22. GLOBAL AMBULATORY SURGICAL CENTERS MARKET VALUE FOR MULTY- SPECIALTY, BY GEOGRAPHY, 2020-2026 (USD MILLION)
TABLE 23. NORTH AMERICA AMBULATORY SURGICAL CENTERS MARKET VALUE, BY COUNTRY, 2020-2026 (USD MILLION)
TABLE 24. NORTH AMERICA AMBULATORY SURGICAL CENTERS MARKET VALUE, BY PRODUCTS & SERVICES, 2020-2026 (USD MILLION)
TABLE 25. NORTH AMERICA AMBULATORY SURGICAL CENTERS MARKET VALUE, BY COMPONENTS, 2020-2026 (USD MILLION)
TABLE 26. NORTH AMERICA AMBULATORY SURGICAL CENTERS MARKET VALUE, BY SPECIALITY, 2020-2026 (USD MILLION)
TABLE 27. U.S AMBULATORY SURGICAL CENTERS MARKET VALUE, BY PRODUCTS & SERVICES, 2020-2026 (USD MILLION)
TABLE 28. U.S AMBULATORY SURGICAL CENTERS MARKET VALUE, BY COMPONENTS, 2020-2026 (USD MILLION)
TABLE 29. U.S AMBULATORY SURGICAL CENTERS MARKET VALUE, BY SPECIALITY, 2020-2026 (USD MILLION)
TABLE 30. CANADA AMBULATORY SURGICAL CENTERS MARKET VALUE, BY PRODUCTS & SERVICES, 2020-2026 (USD MILLION)
TABLE 31. CANADA AMBULATORY SURGICAL CENTERS MARKET VALUE, BY COMPONENTS, 2020-2026 (USD MILLION)
TABLE 32. CANADA AMBULATORY SURGICAL CENTERS MARKET VALUE, BY SPECIALITY, 2020-2026 (USD MILLION)
TABLE 33. EUROPE AMBULATORY SURGICAL CENTERS MARKET VALUE, BY COUNTRY, 2020-2026 (USD MILLION)
TABLE 34. EUROPE AMBULATORY SURGICAL CENTERS MARKET VALUE, BY PRODUCTS & SERVICES, 2020-2026 (USD MILLION)
TABLE 35. EUROPE AMBULATORY SURGICAL CENTERS MARKET VALUE, BY COMPONENTS, 2020-2026 (USD MILLION)
TABLE 36. EUROPE AMBULATORY SURGICAL CENTERS MARKET VALUE, BY SPECIALITY, 2020-2026 (USD MILLION)
TABLE 37. GERMANY AMBULATORY SURGICAL CENTERS MARKET VALUE, BY PRODUCTS & SERVICES, 2020-2026 (USD MILLION)
TABLE 38. GERMANY AMBULATORY SURGICAL CENTERS MARKET VALUE, BY COMPONENTS, 2020-2026 (USD MILLION)
TABLE 39. GERMANY AMBULATORY SURGICAL CENTERS MARKET VALUE, BY SPECIALITY, 2020-2026 (USD MILLION)
TABLE 40. U.K AMBULATORY SURGICAL CENTERS MARKET VALUE, BY PRODUCTS & SERVICES, 2020-2026 (USD MILLION)
TABLE 41. U.K AMBULATORY SURGICAL CENTERS MARKET VALUE, BY COMPONENTS, 2020-2026 (USD MILLION)
TABLE 42. U.K AMBULATORY SURGICAL CENTERS MARKET VALUE, BY SPECIALITY, 2020-2026 (USD MILLION)
TABLE 43. FRANCE AMBULATORY SURGICAL CENTERS MARKET VALUE, BY PRODUCTS & SERVICES, 2020-2026 (USD MILLION)
TABLE 44. FRANCE AMBULATORY SURGICAL CENTERS MARKET VALUE, BY COMPONENTS, 2020-2026 (USD MILLION)
TABLE 45. FRANCE AMBULATORY SURGICAL CENTERS MARKET VALUE, BY SPECIALITY, 2020-2026 (USD MILLION)
TABLE 46. ROE AMBULATORY SURGICAL CENTERS MARKET VALUE, BY PRODUCTS & SERVICES, 2020-2026 (USD MILLION)
TABLE 47. ROE AMBULATORY SURGICAL CENTERS MARKET VALUE, BY COMPONENTS, 2020-2026 (USD MILLION)
TABLE 48. ROE AMBULATORY SURGICAL CENTERS MARKET VALUE, BY SPECIALITY, 2020-2026 (USD MILLION)
TABLE 49. ASIA PACIFIC AMBULATORY SURGICAL CENTERS MARKET VALUE, BY COUNTRY, 2020-2026 (USD MILLION)
TABLE 50. ASIA PACIFIC AMBULATORY SURGICAL CENTERS MARKET VALUE, BY PRODUCTS & SERVICES, 2020-2026 (USD MILLION)
TABLE 51. ASIA PACIFIC AMBULATORY SURGICAL CENTERS MARKET VALUE, BY COMPONENTS, 2020-2026 (USD MILLION)
TABLE 52. ASIA PACIFIC AMBULATORY SURGICAL CENTERS MARKET VALUE, BY SPECIALITY, 2020-2026 (USD MILLION)
TABLE 53. CHINA AMBULATORY SURGICAL CENTERS MARKET VALUE, BY PRODUCTS & SERVICES, 2020-2026 (USD MILLION)
TABLE 54. CHINA AMBULATORY SURGICAL CENTERS MARKET VALUE, BY COMPONENTS, 2020-2026 (USD MILLION)
TABLE 55. CHINA AMBULATORY SURGICAL CENTERS MARKET VALUE, BY SPECIALITY, 2020-2026 (USD MILLION)
TABLE 56. INDIA AMBULATORY SURGICAL CENTERS MARKET VALUE, BY PRODUCTS & SERVICES, 2020-2026 (USD MILLION)
TABLE 57. INDIA AMBULATORY SURGICAL CENTERS MARKET VALUE, BY COMPONENTS, 2020-2026 (USD MILLION)
TABLE 58. INDIA AMBULATORY SURGICAL CENTERS MARKET VALUE, BY SPECIALITY, 2020-2026 (USD MILLION)
TABLE 59. JAPAN AMBULATORY SURGICAL CENTERS MARKET VALUE, BY PRODUCTS & SERVICES, 2020-2026 (USD MILLION)
TABLE 60. JAPAN AMBULATORY SURGICAL CENTERS MARKET VALUE, BY COMPONENTS, 2020-2026 (USD MILLION)
TABLE 61. JAPAN AMBULATORY SURGICAL CENTERS MARKET VALUE, BY SPECIALITY, 2020-2026 (USD MILLION)
TABLE 62. REST OF ASIA PACIFIC AMBULATORY SURGICAL CENTERS MARKET VALUE, BY PRODUCTS & SERVICES, 2020-2026 (USD MILLION)
TABLE 63. REST OF ASIA PACIFIC AMBULATORY SURGICAL CENTERS MARKET VALUE, BY COMPONENTS, 2020-2026 (USD MILLION)
TABLE 64. REST OF ASIA PACIFIC AMBULATORY SURGICAL CENTERS MARKET VALUE, BY SPECIALITY, 2020-2026 (USD MILLION)
TABLE 65. REST OF WORLD AMBULATORY SURGICAL CENTERS MARKET VALUE, BY PRODUCTS & SERVICES, 2020-2026 (USD MILLION)
TABLE 66. REST OF WORLD AMBULATORY SURGICAL CENTERS MARKET VALUE, BY COMPONENTS, 2020-2026 (USD MILLION)
TABLE 67. REST OF WORLD AMBULATORY SURGICAL CENTERS MARKET VALUE, BY SPECIALITY, 2020-2026 (USD MILLION)
TABLE 68. CERNER CORPORATION.: OVERVIEW
TABLE 69. CERNER CORPORATION.: STRATEGIC SNAPSHOT
TABLE 70. CERNER CORPORATION.: BUSINESS OPPORTUNITIES AND OUTLOOK
TABLE 71. CERNER CORPORATION.: PRODUCT/SERVICE PORTFOLIO
TABLE 72. ALLSCRIPTS HEALTHCARE SOLUTIONS, INC: OVERVIEW
TABLE 73. ALLSCRIPTS HEALTHCARE SOLUTIONS, INC: STRATEGIC SNAPSHOT
TABLE 74. ALLSCRIPTS HEALTHCARE SOLUTIONS, INC: BUSINESS OPPORTUNITIES AND OUTLOOK
TABLE 75. ALLSCRIPTS HEALTHCARE SOLUTIONS, INC: PRODUCT/SERVICE PORTFOLIO
TABLE 76. MCKESSON CORPORATION: OVERVIEW
TABLE 77. MCKESSON CORPORATION: STRATEGIC SNAPSHOT
TABLE 78. MCKESSON CORPORATION: BUSINESS OPPORTUNITIES AND OUTLOOK
TABLE 79. MCKESSON CORPORATION: PRODUCT/SERVICE PORTFOLIO
TABLE 80. MERCK & CO..: OVERVIEW
TABLE 81. MERCK & CO..: STRATEGIC SNAPSHOT
TABLE 82. MERCK & CO..: BUSINESS OPPORTUNITIES AND OUTLOOK
TABLE 83. MERCK & CO..: PRODUCT/SERVICE PORTFOLIO
TABLE 84. EPIC SYSTEMS CORPORATION: OVERVIEW
TABLE 85. EPIC SYSTEMS CORPORATION: STRATEGIC SNAPSHOT
TABLE 86. EPIC SYSTEMS CORPORATION: BUSINESS OPPORTUNITIES AND OUTLOOK
TABLE 87. EPIC SYSTEMS CORPORATION: PRODUCT/SERVICE PORTFOLIO
TABLE 88. PHILIPS HEALTHCARE.: OVERVIEW
TABLE 89. PHILIPS HEALTHCARE.: STRATEGIC SNAPSHOT
TABLE 90. PHILIPS HEALTHCARE.: BUSINESS OPPORTUNITIES AND OUTLOOK
TABLE 91. PHILIPS HEALTHCARE.: PRODUCT/SERVICE PORTFOLIO
TABLE 92. GE HEALTHCARE: OVERVIEW
TABLE 93. GE HEALTHCARE: STRATEGIC SNAPSHOT
TABLE 94. GE HEALTHCARE: BUSINESS OPPORTUNITIES AND OUTLOOK
TABLE 95. GE HEALTHCARE: PRODUCT/SERVICE PORTFOLIO
TABLE 96. MEDICAL INFORMATION TECHNOLOGY, INC.: OVERVIEW
TABLE 97. MEDICAL INFORMATION TECHNOLOGY, INC.: STRATEGIC SNAPSHOT
TABLE 98. MEDICAL INFORMATION TECHNOLOGY, INC.: BUSINESS OPPORTUNITIES AND OUTLOOK
TABLE 99. MEDICAL INFORMATION TECHNOLOGY, INC.: PRODUCT/SERVICE PORTFOLIO
TABLE 100. ECLINICAL WORKS: OVERVIEW
TABLE 101. ECLINICAL WORKS: STRATEGIC SNAPSHOT
TABLE 102. ECLINICAL WORKS: BUSINESS OPPORTUNITIES AND OUTLOOK
TABLE 103. ECLINICAL WORKS: PRODUCT/SERVICE PORTFOLIO
TABLE 104. NOVUS INTERNATIONAL, INC.: OVERVIEW
TABLE 105. NOVUS INTERNATIONAL, INC.: STRATEGIC SNAPSHOT
TABLE 106. NOVUS INTERNATIONAL, INC.: BUSINESS OPPORTUNITIES AND OUTLOOK
TABLE 107. NOVUS INTERNATIONAL, INC.: PRODUCT/SERVICE PORTFOLIO
Research Framework
Infoholic Research works on a holistic 360° approach in order to deliver high quality, validated and reliable information in our market reports. The Market estimation and forecasting involves following steps:
- Data Collation (Primary & Secondary)
- In-house Estimation (Based on proprietary data bases and Models)
- Market Triangulation
- Forecasting

Market related information is congregated from both primary and secondary sources.
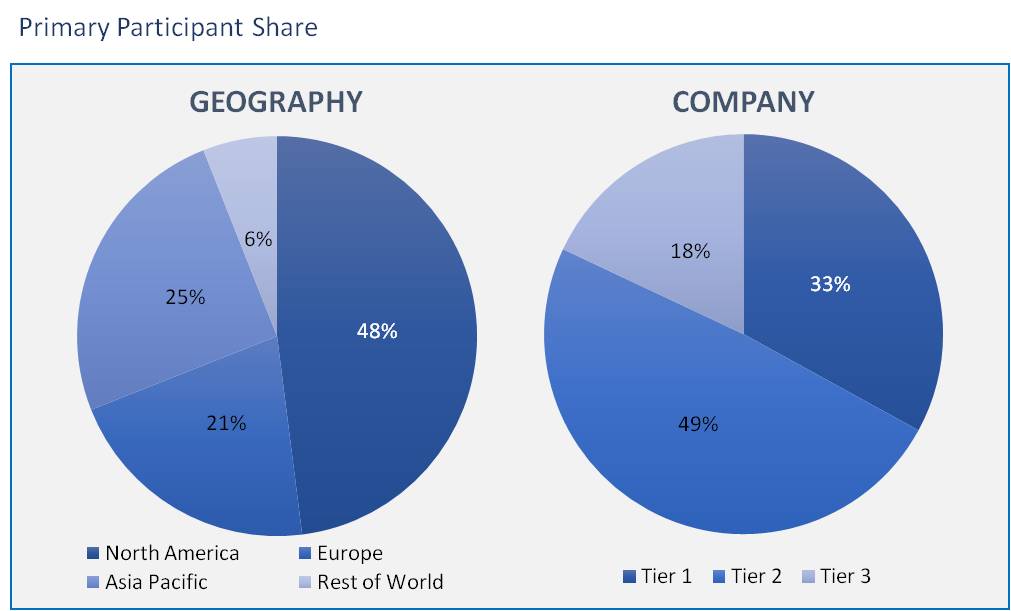
Primary sources
Involved participants from all global stakeholders such as Solution providers, service providers, Industry associations, thought leaders etc. across levels such as CXOs, VPs and managers. Plus, our in-house industry experts having decades of industry experience contribute their consulting and advisory services.
Secondary sources
Include public sources such as regulatory frameworks, government IT spending, government demographic indicators, industry association statistics, and company publications along with paid sources such as Factiva, OneSource, Bloomberg among others.
![]()


