
Aerial Imaging Market by platform (Fixed-wing aircraft, Helicopter, and UAV/drone), Application (Geospatial Mapping, Disaster Management, Energy & resource management, Surveillance & monitoring, Urban Planning, and Conservation and Research), End User (Government, Energy, Military & Defense, Agriculture & Forestry, Archaeology & Civil Engineering, and Oil & Gas), and Geography (North America, Europe, APAC and RoW) - Global Forecast to 2026
- November, 2020
- Domain: ICT - Software & Services
- Get Free 10% Customization in this Report
Aerial imaging refers to the taking of images from an aircraft or other flying vehicle. The flying objects for aerial imaging include fixed-wing aircraft, helicopters, unmanned aerial vehicles, balloons, blimps, and dirigibles. Aerial imaging is generally used for route designing, updating the existing mapping, urban planning, and, most importantly, for survey and inspection with minimal efforts.. The application of aerial imaging has escalated in several sectors, which include agriculture & forestry, energy & resource management, travel and tourism, research and media and entertainment, and others are boosting the growth of the market. Additionally, usage of location-based services for navigating & remote monitoring is projected to impel the aerial imaging market's growth. Somehow, satellite imagery usage as a replacement and restricting government regulations concerning national security restrain the market growth. The Aerial Imaging Market growth is expected to grow at a CAGR of 15.2% during the forecasted period.
Research Methodology:
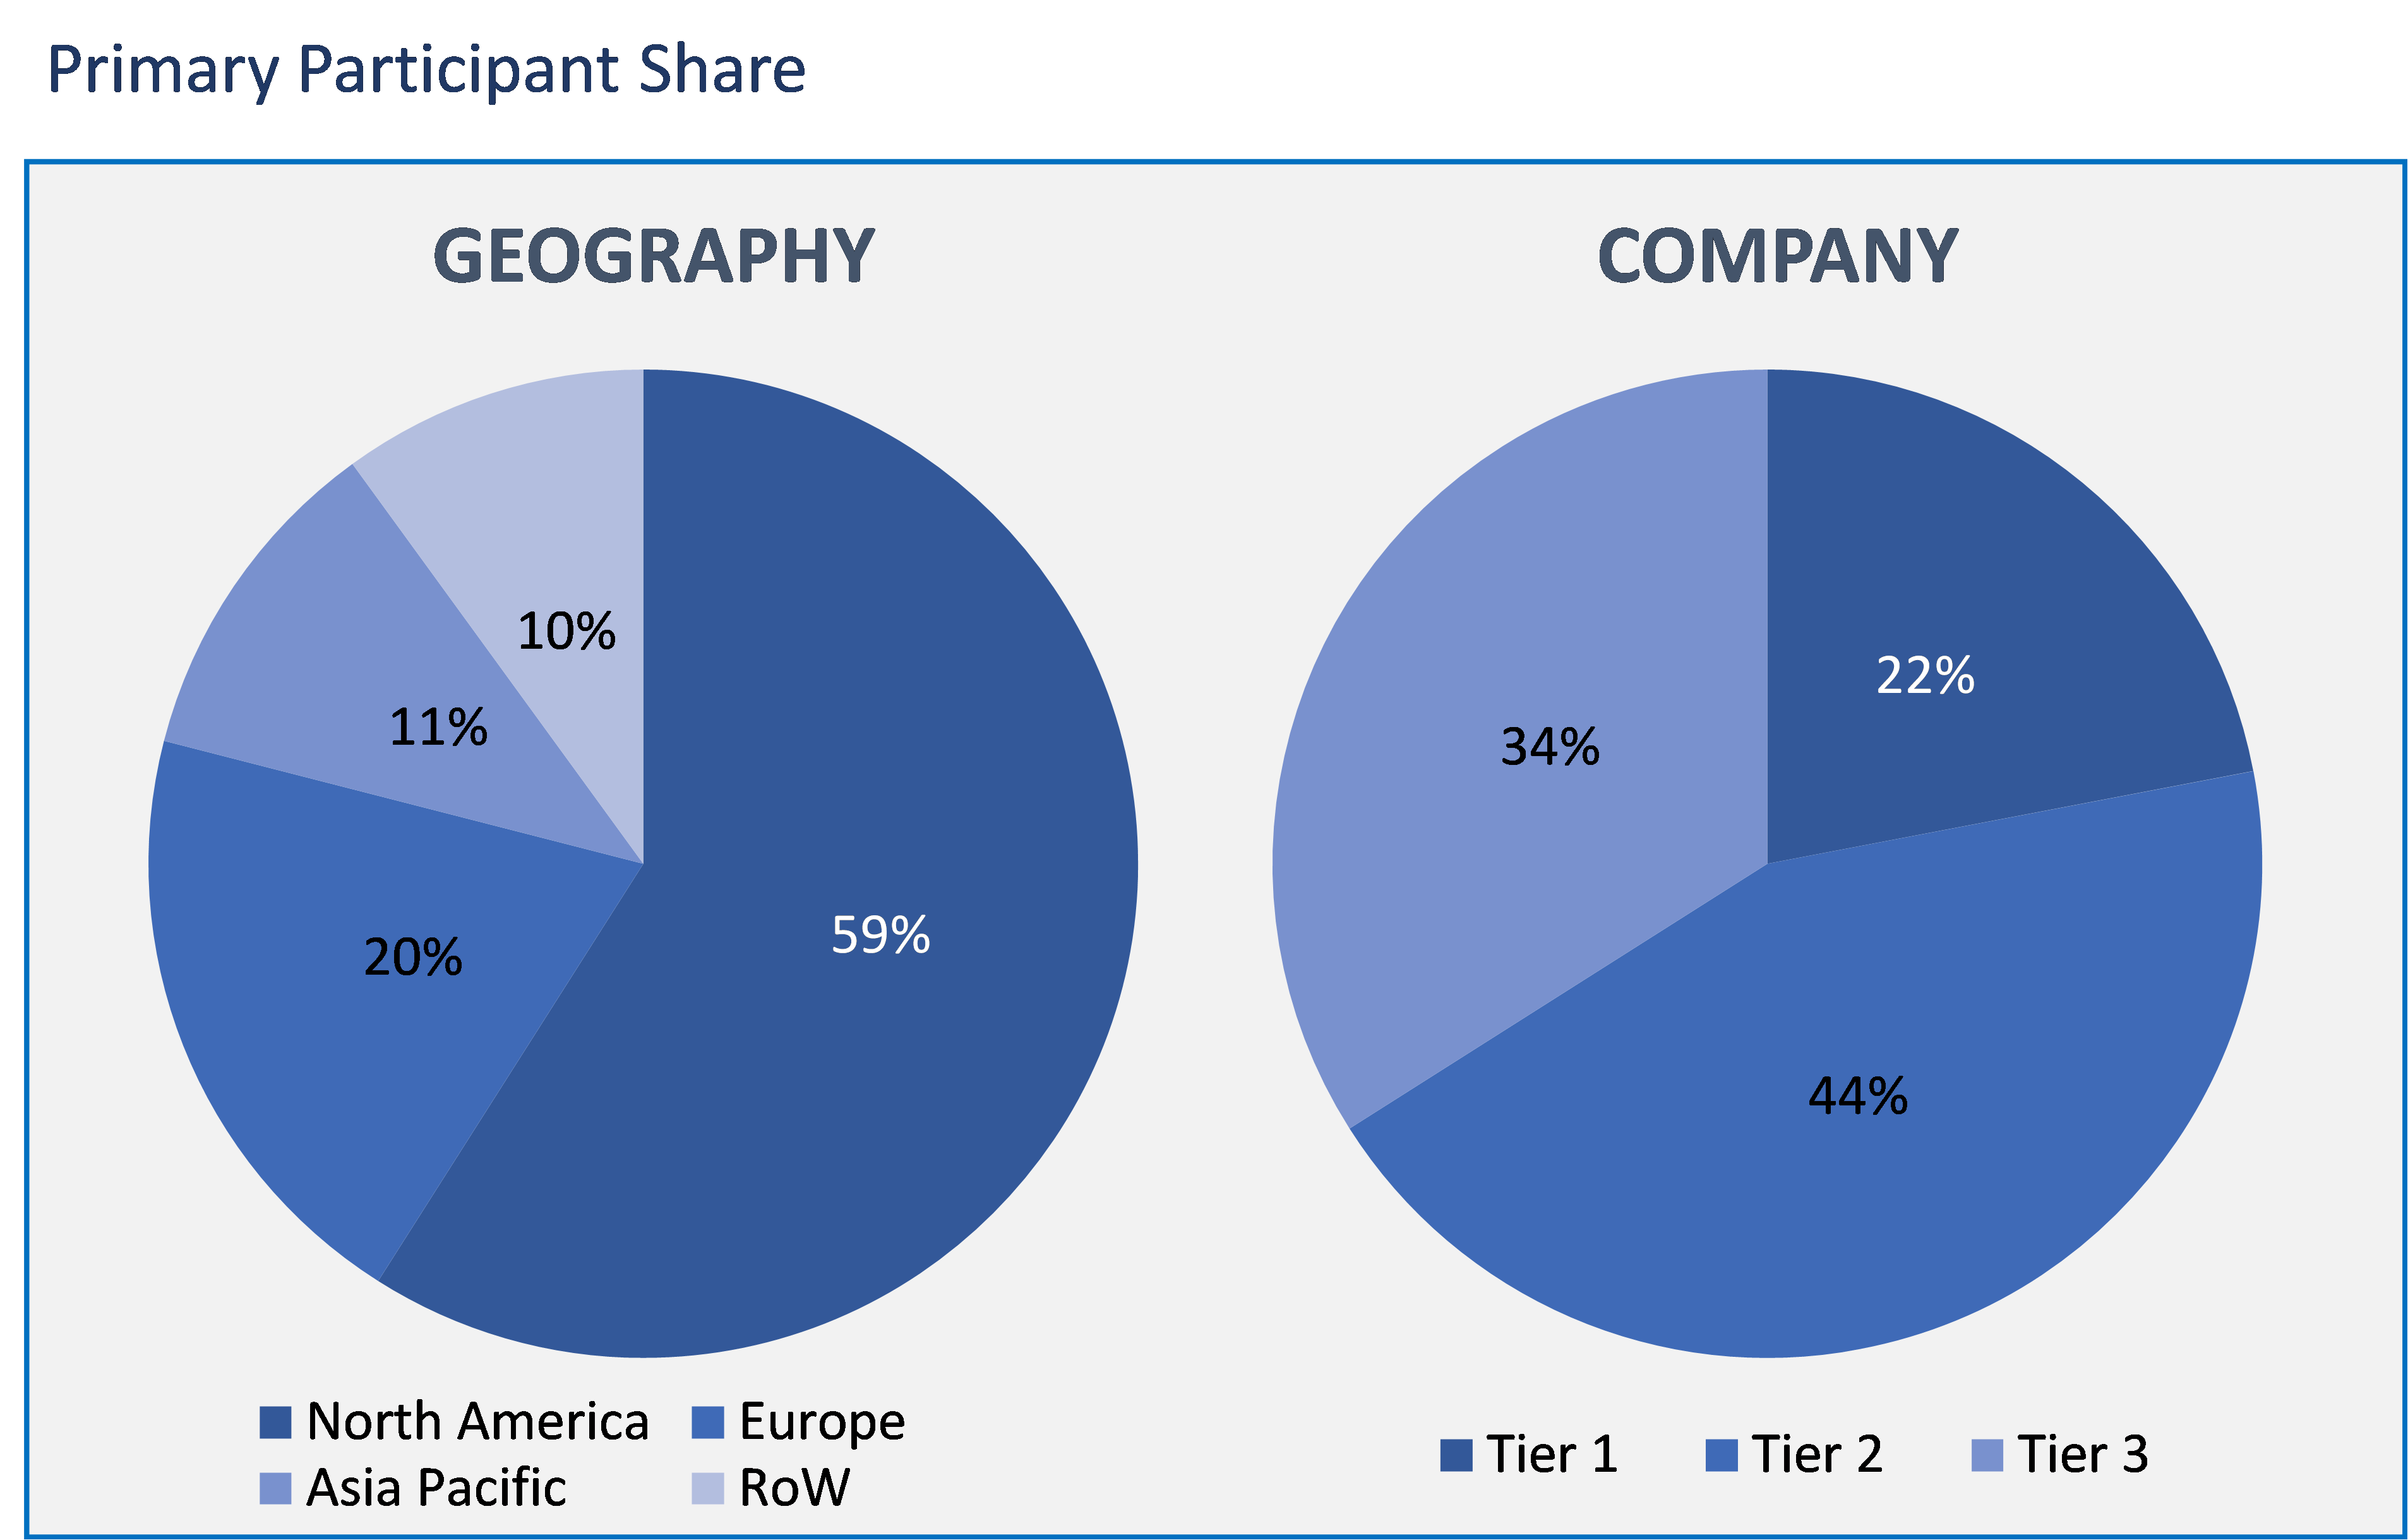
The healthcare fraud analytics market has been analyzed by utilizing the optimum combination of secondary sources and in-house methodology, along with an irreplaceable blend of primary insights. The real-time assessment of the market is an integral part of our market sizing and forecasting methodology. Our industry experts and panel of primary participants have helped in compiling relevant aspects with realistic parametric estimations for a comprehensive study. The participation share of different categories of primary participants is given below:
Aerial Imaging Market by Platform
- Fixed-wing aircraft
- Helicopter
- UAV/drone
Aerial Imaging Market by Application
- Geospatial mapping
- Disaster management
- Energy & resource management
- Surveillance & monitoring
- Urban planning
- Conservation and research
Aerial Imaging Market by End User
- Government
- Energy
- Military & defense
- Agriculture & forestry
- Archaeology & civil engineering
- Oil & gas
Aerial Imaging Market by Geography
- North America
- Europe
- Asia Pacific
- Rest of the World
In the aerial imaging market based on the platform, the unmanned aerial vehicle or drone segment is considered to hold the market's maximum share. The drones are widely used for aerial imaging by the government and military sectors. Since drones and UAVs offer convenience for capturing aerial images in urban areas and government agencies are deploying these drones for law enforcement and criminal investigations.
As in the market by application, the disaster management segment is happening to depict the highest growth rate. This is attributed to the increasing number of natural calamities every year, where the requirement of damage assessment measures also increased. Since, after the occurrence of a disaster, the drones and other aerial vehicles are used to assess and repair and relief requirements by taking images.
In the aerial imaging market, the end-user segment is divided into government, energy, military & defense, agriculture & forestry, archeology & civil engineering, and oil and gas. The agriculture and forestry segment is expected to have lucrative growth in the market. This is due to the advanced technology incorporated in the drones, such as sensors that assist in precise agricultural functions by mapping the various parameters such as soil health, fertility levels, and vegetation.
As per the geographical analysis, North America is extremely dominating the aerial imaging market share. The dominance is due to aerial imaging's growing adoption in the various sectors and deployment of several innovative platforms that include drones and unmanned aerial systems for collecting the necessary data from a high-resolution image. Moreover, aerial platforms' enormously increasing adoption in military and defense in this region is majorly supporting the maximum share in this region.
The rise in the deployment of drone technology has been transforming the global aerial imaging market, which is enabling it to penetrate various areas comprised of agriculture and defense intelligence. Further, the establishments in electronic media, smartphone deployment, advanced technology in wireless applications resulted in numerous companies rendering location-based services. Therefore, the companies employing location-based services such as e-commerce websites, online food supply, social networks, etc., are significantly responsible for the aerial imaging market's growth.
The significant players in the aerial imaging market are ARC Blom ASA, Bluesky International Ltd., Digital Aerial Solutions, LLC, GeoVantage, Getmapping, Kucera International Inc., McKenzie Geospatial Surveys Limited, High Eye Aerial Imaging Inc., Cooper Aerial, Aerial Imaging Limited, Midwest Aerial Photography, and Propellerheads Aerial Photography.
As a result, integrating advanced sensors and technology in cameras coupled with drones, UAVs, and other aerial platforms are observed. The imaging technology is continuously upgrading to assist the military and defense sectors, significantly enhancing the market.
- The market report gives the complete perception of different dynamics affecting the market, such as key driving factors, challenges, and hidden opportunities.
- This report gives an in-depth analysis of a player’s performance in market shares, strategies, product portfolio, and SWOT analysis.
- Also gives the analysis of sales and distribution channels among four significant geographies of the aerial imaging market
Further provides the latest developments and innovative technologies launched by the key players in the aerial imaging market.
- Executive Summary
- Industry Outlook
- Industry Overview
- Industry Trends
- Market Snapshot
- Total Addressable Market
- Segment Addressable Market
- PEST Analysis
- Porter Five Forces
- Related Markets
- Ecosystem
- Market Overview
- Overview
- Market Evolution
- Market Trends and Impact
- Pricing Analysis
- Market Segmentation
- Market Dynamics
- Drivers
- Restraints
- Opportunities
- DRO - Impact Analysis
- Overview
- Platform: Market Size & Analysis
- Overview
- Fixed-wing aircraft
- Helicopter
- UAV/drone
- Application: Market Size & Analysis
- Overview
- Geospatial mapping
- Disaster management
- Energy & resource management
- Surveillance & monitoring
- Urban planning
- Conservation and research
- End-User: Market Size & Analysis
- Overview
- Government
- Energy
- Military & defense
- Agriculture & forestry
- Archaeology & civil engineering
- Oil & gas
- Geography: Market Size & Analysis
- Overview
- North America
- Europe
- Asia Pacific
- Rest of the World
- Competitive Landscape
- Competitor Comparison Analysis
- Market Developments
- Mergers and Acquisitions, Legal, Awards, Partnerships
- Product Launches and execution
- Vendor Profiles
- ARC Blom ASA
- Overview
- Financials
- Products / Services
- Recent Developments
- Business Strategy
- Bluesky International Ltd
- Overview
- Financials
- Products / Services
- Recent Developments
- Business Strategy
- Digital Aerial Solutions, LLC
- Overview
- Financials
- Products / Services
- Recent Developments
- Business Strategy
- GeoVantage
- Overview
- Financials
- Products / Services
- Recent Developments
- Business Strategy
- Getmapping
- Overview
- Financials
- Products / Services
- Recent Developments
- Business Strategy
- Kucera International Inc
- Overview
- Financials
- Products / Services
- Recent Developments
- Business Strategy
- McKenzie Geospatial Surveys Limited
- Overview
- Financials
- Products / Services
- Recent Developments
- Business Strategy
- High Eye Aerial Imaging Inc
- Overview
- Financials
- Products / Services
- Recent Developments
- Business Strategy
- Cooper Aerial
- Overview
- Financials
- Products / Services
- Recent Developments
- Business Strategy
- Aerial Imaging Limited
- Overview
- Financials
- Products / Services
- Recent Developments
- Business Strategy
- ARC Blom ASA
- Companies to Watch
- Analyst Opinion
- Annexure
- Report Scope
- Market Definitions
- Research Methodology
- Data Collation and In-house Estimation
- Market Triangulation
- Forecasting
- Report Assumptions
- Declarations
- Stakeholders
- Abbreviations
TABLE 1. GLOBAL AERIAL IMAGING MARKET VALUE, BY PLATFORM, 2020-2026 (USD BILLION)
TABLE 2. GLOBAL AERIAL IMAGING MARKET VALUE FOR FIXED-WING AIRCRAFT, BY GEOGRAPHY, 2020-2026 (USD BILLION)
TABLE 3. GLOBAL AERIAL IMAGING MARKET VALUE FOR HELICOPTER, BY GEOGRAPHY, 2020-2026 (USD BILLION)
TABLE 4. GLOBAL AERIAL IMAGING MARKET VALUE FOR UAV/DRONE, BY GEOGRAPHY, 2020-2026 (USD BILLION)
TABLE 5. GLOBAL AERIAL IMAGING MARKET VALUE, BY APPLICATION, 2020-2026 (USD BILLION)
TABLE 6. GLOBAL AERIAL IMAGING MARKET VALUE FOR GEOSPATIAL MAPPING, BY GEOGRAPHY, 2020-2026 (USD BILLION)
TABLE 7. GLOBAL AERIAL IMAGING MARKET VALUE FOR DISASTER MANAGEMENT, BY GEOGRAPHY, 2020-2026 (USD BILLION)
TABLE 8. GLOBAL AERIAL IMAGING MARKET VALUE FOR ENERGY & RESOURCE MANAGEMENT, BY GEOGRAPHY, 2020-2026 (USD BILLION)
TABLE 9. GLOBAL AERIAL IMAGING MARKET VALUE FOR SURVEILLANCE & MONITORING, BY GEOGRAPHY, 2020-2026 (USD BILLION)
TABLE 10. GLOBAL AERIAL IMAGING MARKET VALUE FOR URBAN PLANNING, BY GEOGRAPHY, 2020-2026 (USD BILLION)
TABLE 11. GLOBAL AERIAL IMAGING MARKET VALUE FOR CONSERVATION AND RESEARCH, BY GEOGRAPHY, 2020-2026 (USD BILLION)
TABLE 12. GLOBAL AERIAL IMAGING MARKET VALUE, BY END USE, 2020-2026 (USD BILLION)
TABLE 13. GLOBAL AERIAL IMAGING MARKET VALUE FOR GOVERNMENT, 2020-2026 (USD BILLION)
TABLE 14. GLOBAL AERIAL IMAGINGMARKET VALUE FOR ENERGY, BY GEOGRAPHY, 2020-2026 (USD BILLION)
TABLE 15. GLOBAL AERIAL IMAGING MARKET VALUE FOR MILITARY & DEFENSE, BY GEOGRAPHY, 2020-2026 (USD BILLION)
TABLE 16. GLOBAL AERIAL IMAGING MARKET VALUE FOR AGRICULTURE & FORESTRY, BY GEOGRAPHY, 2020-2026 (USD BILLION)
TABLE 17. GLOBAL AERIAL IMAGING MARKET VALUE FOR ARCHAEOLOGY & CIVIL ENGINEERING, BY GEOGRAPHY, 2020-2026 (USD BILLION)
TABLE 18. GLOBAL AERIAL IMAGING MARKET VALUE FOR OIL & GAS, BY GEOGRAPHY, 2020-2026 (USD BILLION)
TABLE 19. NORTH AMERICA AERIAL IMAGING MARKET VALUE, BY COUNTRY, 2020-2026 (USD BILLION)
TABLE 20. NORTH AMERICA AERIAL IMAGING MARKET VALUE, BY PLATFORM, 2020-2026 (USD BILLION)
TABLE 21. NORTH AMERICA AERIAL IMAGING MARKET VALUE, BY APPLICATION, 2020-2026 (USD BILLION)
TABLE 22. NORTH AMERICA AERIAL IMAGING MARKET VALUE, BY END USE, 2020-2026 (USD BILLION)
TABLE 23. U.S AERIAL IMAGING MARKET VALUE, BY PLATFORM, 2020-2026 (USD BILLION)
TABLE 24. U.S AERIAL IMAGING MARKET VALUE, BY APPLICATION, 2020-2026 (USD BILLION)
TABLE 25. U.S AERIAL IMAGING MARKET VALUE, BY END USE, 2020-2026 (USD BILLION)
TABLE 26. CANADA AERIAL IMAGING MARKET VALUE, BY PLATFORM, 2020-2026 (USD BILLION)
TABLE 27. CANADA AERIAL IMAGING MARKET VALUE, BY APPLICATION, 2020-2026 (USD BILLION)
TABLE 28. CANADA AERIAL IMAGING MARKET VALUE, BY END USE, 2020-2026 (USD BILLION)
TABLE 29. EUROPE AERIAL IMAGING MARKET VALUE, BY COUNTRY, 2020-2026 (USD BILLION)
TABLE 30. EUROPE AERIAL IMAGING MARKET VALUE, BY PLATFORM, 2020-2026 (USD BILLION)
TABLE 31. EUROPE AERIAL IMAGING MARKET VALUE, BY APPLICATION, 2020-2026 (USD BILLION)
TABLE 32. EUROPE AERIAL IMAGING MARKET VALUE, END USE, 2020-2026 (USD BILLION)
TABLE 33. GERMANY AERIAL IMAGING MARKET VALUE, BY PLATFORM, 2020-2026 (USD BILLION)
TABLE 34. GERMANY AERIAL IMAGING MARKET VALUE, BY APPLICATION, 2020-2026 (USD BILLION)
TABLE 35. GERMANY AERIAL IMAGING MARKET VALUE, BY END USE, 2020-2026 (USD BILLION)
TABLE 36. U.K AERIAL IMAGING MARKET VALUE, BY PLATFORM, 2020-2026 (USD BILLION)
TABLE 37. U.K AERIAL IMAGING MARKET VALUE, BY APPLICATION, 2020-2026 (USD BILLION)
TABLE 38. U.K AERIAL IMAGING MARKET VALUE, BY END USE, 2020-2026 (USD BILLION)
TABLE 39. FRANCE AERIAL IMAGING MARKET VALUE, BY PLATFORM, 2020-2026 (USD BILLION)
TABLE 40. FRANCE AERIAL IMAGING MARKET VALUE, BY APPLICATION, 2020-2026 (USD BILLION)
TABLE 41. FRANCE AERIAL IMAGING MARKET VALUE, BY END USE, 2020-2026 (USD BILLION)
TABLE 42. ITALY AERIAL IMAGING MARKET VALUE, BY PLATFORM, 2020-2026 (USD BILLION)
TABLE 43. ITALY AERIAL IMAGING MARKET VALUE, BY APPLICATION, 2020-2026 (USD BILLION)
TABLE 44. ITALY AERIAL IMAGING MARKET VALUE, BY END USE, 2020-2026 (USD BILLION)
TABLE 45. SPAIN AERIAL IMAGING MARKET VALUE, BY PLATFORM, 2020-2026 (USD BILLION)
TABLE 46. SPAIN AERIAL IMAGING MARKET VALUE, BY APPLICATION, 2020-2026 (USD BILLION)
TABLE 47. SPAIN AERIAL IMAGING MARKET VALUE, BY END USE, 2020-2026 (USD BILLION)
TABLE 48. ROE AERIAL IMAGING MARKET VALUE, BY PLATFORM, 2020-2026 (USD BILLION)
TABLE 49. ROE AERIAL IMAGING MARKET VALUE, BY APPLICATION, 2020-2026 (USD BILLION)
TABLE 50. ROE AERIAL IMAGING MARKET VALUE, BY END USE, 2020-2026 (USD BILLION)
TABLE 51. ASIA PACIFC AERIAL IMAGING MARKET VALUE, BY COUNTRY, 2020-2026 (USD BILLION)
TABLE 52. ASIA PACIFC AERIAL IMAGING MARKET VALUE, BY PLATFORM, 2020-2026 (USD BILLION)
TABLE 53. ASIA PACIFC AERIAL IMAGING MARKET VALUE, BY APPLICATION, 2020-2026 (USD BILLION)
TABLE 54. ASIA PACIFC AERIAL IMAGING MARKET VALUE, BY END USE, 2020-2026 (USD BILLION)
TABLE 55. CHINA AERIAL IMAGING MARKET VALUE, BY PLATFORM, 2020-2026 (USD BILLION)
TABLE 56. CHINA AERIAL IMAGING MARKET VALUE, BY APPLICATION, 2020-2026 (USD BILLION)
TABLE 57. CHINA AERIAL IMAGING MARKET VALUE, BY END USE, 2020-2026 (USD BILLION)
TABLE 58. INDIA AERIAL IMAGING MARKET VALUE, BY PLATFORM, 2020-2026 (USD BILLION)
TABLE 59. INDIA AERIAL IMAGING MARKET VALUE, BY APPLICATION, 2020-2026 (USD BILLION)
TABLE 60. INDIA AERIAL IMAGING MARKET VALUE, BY END USE, 2020-2026 (USD BILLION)
TABLE 61. JAPAN AERIAL IMAGING MARKET VALUE, BY PLATFORM, 2020-2026 (USD BILLION)
TABLE 62. JAPAN AERIAL IMAGING MARKET VALUE, BY APPLICATION, 2020-2026 (USD BILLION)
TABLE 63. JAPAN AERIAL IMAGING MARKET VALUE, BY END USE, 2020-2026 (USD BILLION)
TABLE 64. REST OF APAC AERIAL IMAGING MARKET VALUE, BY PLATFORM, 2020-2026 (USD BILLION)
TABLE 65. REST OF APAC AERIAL IMAGING MARKET VALUE, BY APPLICATION, 2020-2026 (USD BILLION)
TABLE 66. REST OF APAC AERIAL IMAGING MARKET VALUE, BY END USE, 2020-2026 (USD BILLION)
TABLE 67. REST OF WORLD AERIAL IMAGING MARKET VALUE, BY PLATFORM, 2020-2026 (USD BILLION)
TABLE 68. REST OF WORLD AERIAL IMAGING MARKET VALUE, BY APPLICATION, 2020-2026 (USD BILLION)
TABLE 69. REST OF WORLD AERIAL IMAGING MARKET VALUE, BY END USE, 2020-2026 (USD BILLION)
TABLE 70. ARC BLOM ASA: FINANCIALS
TABLE 71. ARC BLOM ASA: PRODUCTS & SERVICES
TABLE 72. ARC BLOM ASA: RECENT DEVELOPMENTS
TABLE 73. BLUESKY INTERNATIONAL LTD: FINANCIALS
TABLE 74. BLUESKY INTERNATIONAL LTD: PRODUCTS & SERVICES
TABLE 75. BLUESKY INTERNATIONAL LTD: RECENT DEVELOPMENTS
TABLE 76. DIGITAL AERIAL SOLUTIONS, LLC: FINANCIALS
TABLE 77. DIGITAL AERIAL SOLUTIONS, LLC: PRODUCTS & SERVICES
TABLE 78. DIGITAL AERIAL SOLUTIONS, LLC: RECENT DEVELOPMENTS
TABLE 79. GEOVANTAGE: FINANCIALS
TABLE 80. GEOVANTAGE: PRODUCTS & SERVICES
TABLE 81. GEOVANTAGE: RECENT DEVELOPMENTS
TABLE 82. GETMAPPING: FINANCIALS
TABLE 83. GETMAPPING: PRODUCTS & SERVICES
TABLE 84. GETMAPPING: RECENT DEVELOPMENTS
TABLE 85. KUCERA INTERNATIONAL INC: FINANCIALS
TABLE 86. KUCERA INTERNATIONAL INC: PRODUCTS & SERVICES
TABLE 87. KUCERA INTERNATIONAL INC: RECENT DEVELOPMENTS
TABLE 88. MCKENZIE GEOSPATIAL SURVEYS LIMITED: FINANCIALS
TABLE 89. MCKENZIE GEOSPATIAL SURVEYS LIMITED: PRODUCTS & SERVICES
TABLE 90. MCKENZIE GEOSPATIAL SURVEYS LIMITED: RECENT DEVELOPMENTS
TABLE 91. HIGH EYE AERIAL IMAGING INC: FINANCIALS
TABLE 92. HIGH EYE AERIAL IMAGING INC: PRODUCTS & SERVICES
TABLE 93. HIGH EYE AERIAL IMAGING INC: RECENT DEVELOPMENTS
TABLE 94. COOPER AERIAL: FINANCIALS
TABLE 95. COOPER AERIAL: PRODUCTS & SERVICES
TABLE 96. COOPER AERIAL: RECENT DEVELOPMENTS
TABLE 97. AERIAL IMAGING LIMITED: FINANCIALS
TABLE 98. AERIAL IMAGING LIMITED: PRODUCTS & SERVICES
TABLE 99. AERIAL IMAGING LIMITED: RECENT DEVELOPMENTS
TABLE 100. MIDWEST AERIAL PHOTOGRAPHY: PRODUCTS & SERVICES
TABLE 101. PROPELLERHEADS AERIAL PHOTOGRAPHY: PRODUCTS & SERVICES
Research Framework
Infoholic Research works on a holistic 360° approach in order to deliver high quality, validated and reliable information in our market reports. The Market estimation and forecasting involves following steps:
- Data Collation (Primary & Secondary)
- In-house Estimation (Based on proprietary data bases and Models)
- Market Triangulation
- Forecasting

Market related information is congregated from both primary and secondary sources.
Primary sources
Involved participants from all global stakeholders such as Solution providers, service providers, Industry associations, thought leaders etc. across levels such as CXOs, VPs and managers. Plus, our in-house industry experts having decades of industry experience contribute their consulting and advisory services.
Secondary sources
Include public sources such as regulatory frameworks, government IT spending, government demographic indicators, industry association statistics, and company publications along with paid sources such as Factiva, OneSource, Bloomberg among others.
![]()


