
5G Equipment Market by End-Users (Retail Sector and Non-Retail Sector), Components (AAU, BBU, RRU, Small cells, Macro cells, RF Filter and Phase shifters) and Geography – Global Forecast up to 2026
- February, 2021
- Domain: ICT - Telecommunications
- Get Free 10% Customization in this Report
5G technology is still in the emerging stage and is assumed to deliver better and advanced user experience for several uses such as Ultra-high Definition (UHD) video, uninterrupted video calling and Virtual Reality (VR) and Augmented Reality (AR) gaming. In an attempt to survive in an intensely competitive environment, various manufacturing facilities are merging on technological transformations to enhance their complete productivity, operational efficiency, and minimize cost. The major factors impelling the market growth are rapidly increasing usage of smartphones in the past few decades, which result in a rise in the mobile data traffic and enormously increased mobile data usage in overall industries creating demand for 5G technology. Apart from that, the delay in the normalization of spectrum regulation is hindering the market growth. 5G Equipment Market is predicted to grow at a CAGR of 33.1%, with a value expecting to reach $50.3 billion by 2026.
Research Methodology:
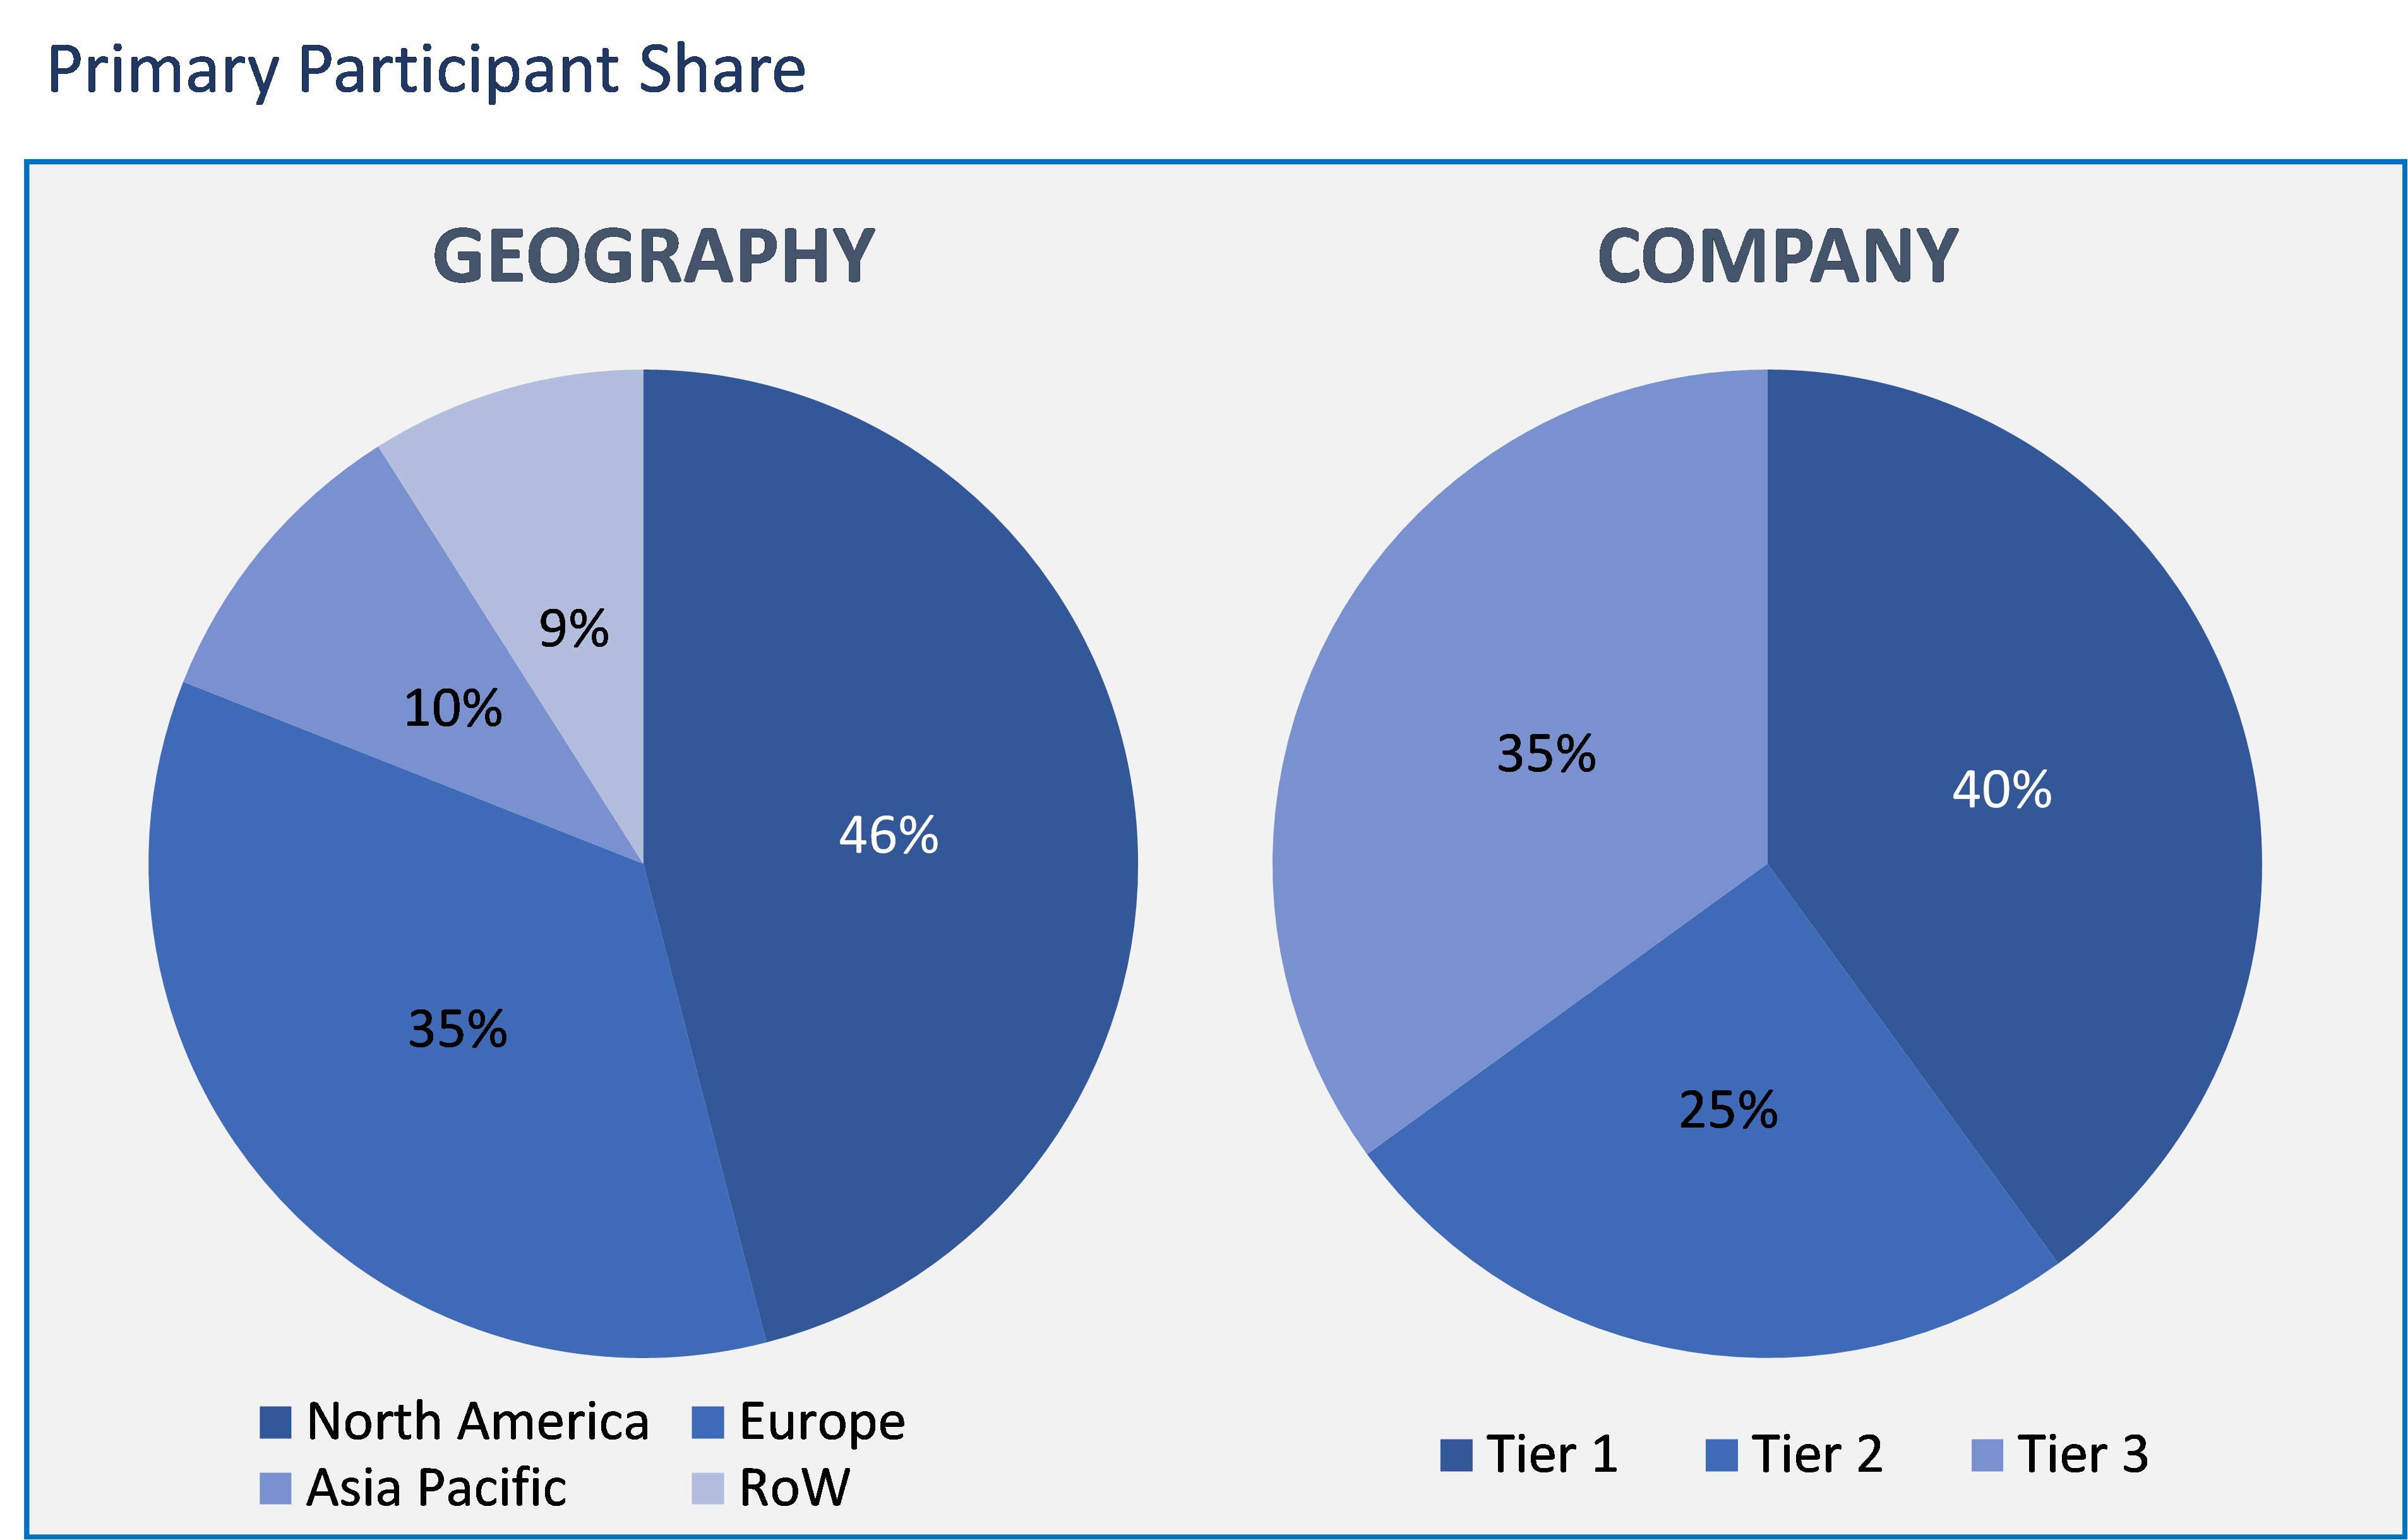
The 5G equipment market has been analyzed by utilizing the optimum combination of secondary sources and in-house methodology, along with an irreplaceable blend of primary insights. The real-time assessment of the market is an integral part of our market sizing and forecasting methodology. Our industry experts and panel of primary participants have helped in compiling relevant aspects with realistic parametric estimations for a comprehensive study. The participation share of different categories of primary participants is given below:
The 5G Equipment Market size and analysis is emphasized by various segments such as end-user, components, and geography.
End-User: Market Size & Analysis
- Retail Sector
- Non-retail Sector
Components: Market Size & Analysis
- AAU
- BBU
- RRU
- Small cells
- Macro cells
- RF Filter
- Phase shifters
Geography: Market Size & Analysis
- North America
- Europe
- Asia Pacific
- Rest of the World
The 5G equipment market based on end-user is segregated into two sectors, such as the retail sector and the non-retail sector. The non-retailer segment tends to have a large share in the market due to the future potential of the evolution of 5G technology in the non-retailer sector as well as the sprouting opportunities in the internet of things and machine to machine communication technologies, and 5G technology is anticipated to play a significant role in the other non-retailer sector.
In the 5G equipment market, among the AAU, BBU, RRU, Small cells, Macro cells, RF Filter, and Phase shifters in the market segmentation of components, the small cells are widely deployed in the present scenario. Since small cells enable flexibility, capable of providing quality of service at the minimum cost, and moreover, it is ecologically friendly as it minimizes the cell towers and it delivers a seamless signal with low power.
Further, the geographical market of 5G Equipment is divided amidst North America, Europe, Asia Pacific, and the Rest of the World. North America is the largest contributor in the market share among other regions due to the large number of research and development activities in 5G network and also the early adoption of new and latest technologies such as wearables, automatic cars, the internet of things, and other smart appliances which require advanced, fast and reliable network which is possible with 5G technology. On the other hand, Europe is standing in the second position in the market share due to the high interest of the government is investing in the 5G framework for the rapid deployment of this network in this region.
The extremely increasing demand for 5G technology globally is boosting the demand for the 5G equipment market. The other major reasons for the demand for this market are the fast and reliability of the 5G network; in telecommunications, there is a thriving adoption of virtual networking architecture and rising machine to machine connections among the number of industries. Apart from that, the rising demand from various numbers of applications is creating an opportunity for increasing demand for 5G network.
Huawei Technologies, Nokia, Qualcomm, Samsung, Singtel, SK Telecom, Ericsson, Telenor, ZTE, Mavenir, NTT Docomo, Siklu Communication, and Comba Telecom Systems. These companies play a major role in the 5G Equipment market growth.
Therefore, with the increasing technology and the soaring requirements of the end-users in terms of network, it is predicted that the 5G Equipment market would grow at the highest CAGR during the forecast period. This report will depict an overall analysis of the factors driving the market growth.
- This study divides the 5G equipment market inclusively and denotes the adjacent market size prediction for all subdivisions among different regions.
- The research assists shareholders of the market in getting a perspective of the pulse of the market and gives the details on major drivers, restraints, challenges, and opportunities for market growth.
- This study also helps shareholders to apprehend the value-chain of the 5G infrastructure market along with the latest research.
- This research gives the analysis of the competitors in the market for the shareholders to obtain more information on competition to develop their position in the market.
- Executive Summary
- Industry Outlook
- Industry Overview
- Industry Trends
- Market Snapshot
- Total Adressable Market
- Segment Addressable Market
- PEST Analysis
- Porter Five Forces
- Related Markets
- Ecosystem
- Market Outlook
- Overview
- Market Evolution
- Market Trends and Impact
- Pricing Analysis
- Market Segmentation
- Market Dynamics
- Drivers
- Restraints
- Opportunities
- DRO - Impact Analysis
- Overview
- End User: Market Size & Analysis
- Retail Sector
- Non-retail Sector
- Components: Market Size & Analysis
- AAU
- BBU
- RRU
- Small cells
- Macro cells
- RF Filter
- Phase shifters
- Geography: Market Size & Analysis
- North America
- Europe
- Asia Pacific
- Rest of the World
- Competitive Landscape
- Competitor Comparison Analysis
- Market Developments
- Mergers and Acquisitions, Legal, Awards, Partnerships
- Product Launches and execution
- Vendor Profiles
- ERICSSON
- Overview
- Financials
- Products & Services
- Recent Developments
- Business Strategy
- HUAWEI TECHNOLOGIES
- Overview
- Financials
- Products & Services
- Recent Developments
- Business Strategy
- NOKIA
- Overview
- Financials
- Products & Services
- Recent Developments
- Business Strategy
- NTT DOCOMO
- Overview
- Financials
- Products & Services
- Recent Developments
- Business Strategy
- QUALCOMM
- Overview
- Financials
- Products & Services
- Recent Developments
- Business Strategy
- SAMSUNG
- Overview
- Financials
- Products & Services
- Recent Developments
- Business Strategy
- SINGTEL
- Overview
- Financials
- Products & Services
- Recent Developments
- Business Strategy
- SK TELECOM
- Overview
- Financials
- Products & Services
- Recent Developments
- Business Strategy
- TELENOR
- Overview
- Financials
- Products & Services
- Recent Developments
- Business Strategy
- ZTE
- Overview
- Financials
- Products & Services
- Recent Developments
- Business Strategy
- ERICSSON
- Companies to Watch
- Verizon Communications
- Overview
- Products & Services
- Business Strategy
- AT&T
- Overview
- Products & Services
- Business Strategy
- SK Telecom
- Overview
- Products & Services
- Business Strategy
- T-Mobile
- Overview
- Products & Services
- Business Strategy
- Hewlett Packard Enterprise
- Overview
- Products & Services
- Business Strategy
- Korea Telecom
- Overview
- Products & Services
- Business Strategy
- Extreme Networks
- Overview
- Products & Services
- Business Strategy
- American Tower
- Overview
- Products & Services
- Business Strategy
- Fujitsu
- Overview
- Products & Services
- Business Strategy
- China Mobile
- Overview
- Products & Services
- Business Strategy
- Verizon Communications
- Analyst Opinion
- Annexure
- Report Scope
- Market Definitions
- Research Methodology
- Data Collation and In-house Estimation
- Market Triangulation
- Forecasting
- Report Assumptions
- Declarations
- Stakeholders
- Abbreviations
TABLE 1. GLOBAL 5G EQUIPMENT MARKET VALUE, BY END USER, 2020-2026 (USD MILLION)
TABLE 2. GLOBAL 5G EQUIPMENT MARKET VALUE FOR RETAIL SECTOR, BY GEOGRAPHY, 2020-2026 (USD MILLION)
TABLE 3. GLOBAL 5G EQUIPMENT MARKET VALUE FOR NON-RETAIL SECTOR, BY GEOGRAPHY, 2020-2026 (USD MILLION)
TABLE 4. GLOBAL 5G EQUIPMENT MARKET VALUE FOR COMPONENT, BY GEOGRAPHY, 2020-2026 (USD MILLION)
TABLE 5. GLOBAL 5G EQUIPMENT MARKET VALUE FOR AAU, BY GEOGRAPHY, 2020-2026 (USD MILLION)
TABLE 6. GLOBAL 5G EQUIPMENT MARKET VALUE FOR BBU, BY GEOGRAPHY, 2020-2026 (USD MILLION)
TABLE 7. GLOBAL 5G EQUIPMENT MARKET VALUE FOR RRU, BY GEOGRAPHY, 2020-2026 (USD MILLION)
TABLE 8. GLOBAL 5G EQUIPMENT MARKET VALUE FOR SMALL CELLS, BY GEOGRAPHY, 2020-2026 (USD MILLION)
TABLE 9. GLOBAL 5G EQUIPMENT MARKET VALUE FOR MICRO CELLS, BY GEOGRAPHY, 2020-2026 (USD MILLION)
TABLE 10. GLOBAL 5G EQUIPMENT MARKET VALUE FOR RF FILTER, BY GEOGRAPHY, 2020-2026 (USD MILLION)
TABLE 11. GLOBAL 5G EQUIPMENT MARKET VALUE FOR PHASE SHIFTERS, BY GEOGRAPHY, 2020-2026 (USD MILLION)
TABLE 12. NORTH AMERICA 5G EQUIPMENT MARKET VALUE, BY COUNTRY, 2020-2026 (USD MILLION)
TABLE 13. NORTH AMERICA 5G EQUIPMENT MARKET VALUE, BY END USER, 2020-2026 (USD MILLION)
TABLE 14. NORTH AMERICA 5G EQUIPMENT MARKET VALUE, BY COMPONENT, 2020-2026 (USD MILLION)
TABLE 15. U.S 5G EQUIPMENT MARKET VALUE, BY END USER, 2020-2026 (USD MILLION)
TABLE 16. U.S 5G EQUIPMENT MARKET VALUE, BY COMPONENT, 2020-2026 (USD MILLION)
TABLE 17. CANADA 5G EQUIPMENT MARKET VALUE, BY END USER, 2020-2026 (USD MILLION)
TABLE 18. CANADA 5G EQUIPMENT MARKET VALUE, BY COMPONENT, 2020-2026 (USD MILLION)
TABLE 19. EUROPE 5G EQUIPMENT MARKET VALUE, BY COUNTRY, 2020-2026 (USD MILLION)
TABLE 20. EUROPE 5G EQUIPMENT MARKET VALUE, BY END USER, 2020-2026 (USD MILLION)
TABLE 21. EUROPE 5G EQUIPMENT MARKET VALUE, BY COMPONENT, 2020-2026 (USD MILLION)
TABLE 22. GERMANY 5G EQUIPMENT MARKET VALUE, BY END USER, 2020-2026 (USD MILLION)
TABLE 23. GERMANY 5G EQUIPMENT MARKET VALUE, BY COMPONENT, 2020-2026 (USD MILLION)
TABLE 24. U.K 5G EQUIPMENT MARKET VALUE, BY END USER, 2020-2026 (USD MILLION)
TABLE 25. U.K 5G EQUIPMENT MARKET VALUE, BY COMPONENT, 2020-2026 (USD MILLION)
TABLE 26. ITALY 5G EQUIPMENT MARKET VALUE, BY END USER, 2020-2026 (USD MILLION)
TABLE 27. ITALY 5G EQUIPMENT MARKET VALUE, BY COMPONENT, 2020-2026 (USD MILLION)
TABLE 28. FRANCE 5G EQUIPMENT MARKET VALUE, BY END USER, 2020-2026 (USD MILLION)
TABLE 29. FRANCE 5G EQUIPMENT MARKET VALUE, BY COMPONENT, 2020-2026 (USD MILLION)
TABLE 30. SPAIN 5G EQUIPMENT MARKET VALUE, BY END USER, 2020-2026 (USD MILLION)
TABLE 31. SPAIN 5G EQUIPMENT MARKET VALUE, BY COMPONENT, 2020-2026 (USD MILLION)
TABLE 32. RUSSIA 5G EQUIPMENT MARKET VALUE, BY END USER, 2020-2026 (USD MILLION)
TABLE 33. RUSSIA 5G EQUIPMENT MARKET VALUE, BY COMPONENT, 2020-2026 (USD MILLION)
TABLE 34. REST OF EUROPE 5G EQUIPMENT MARKET VALUE, BY END USER, 2020-2026 (USD MILLION)
TABLE 35. REST OF EUROPE 5G EQUIPMENT MARKET VALUE, BY COMPONENT, 2020-2026 (USD MILLION)
TABLE 36. ASIA PACIFIC 5G EQUIPMENT MARKET VALUE, BY COUNTRY, 2020-2026 (USD MILLION)
TABLE 37. ASIA PACIFIC 5G EQUIPMENT MARKET VALUE, BY END USER, 2020-2026 (USD MILLION)
TABLE 38. ASIA PACIFIC 5G EQUIPMENT MARKET VALUE, BY COMPONENT, 2020-2026 (USD MILLION)
TABLE 39. CHINA 5G EQUIPMENT MARKET VALUE, BY END USER, 2020-2026 (USD MILLION)
TABLE 40. CHINA 5G EQUIPMENT MARKET VALUE, BY COMPONENT, 2020-2026 (USD MILLION)
TABLE 41. INDIA 5G EQUIPMENT MARKET VALUE, BY END USER, 2020-2026 (USD MILLION)
TABLE 42. INDIA 5G EQUIPMENT MARKET VALUE, BY COMPONENT, 2020-2026 (USD MILLION)
TABLE 43. JAPAN 5G EQUIPMENT MARKET VALUE, BY END USER, 2020-2026 (USD MILLION)
TABLE 44. JAPAN 5G EQUIPMENT MARKET VALUE, BY COMPONENT, 2020-2026 (USD MILLION)
TABLE 45. SOUTH KOREA 5G EQUIPMENT MARKET VALUE, BY END USER, 2020-2026 (USD MILLION)
TABLE 46. SOUTH KOREA 5G EQUIPMENT MARKET VALUE, BY COMPONENT, 2020-2026 (USD MILLION)
TABLE 47. REST OF ASIA PACIFIC 5G EQUIPMENT MARKET VALUE, BY END USER, 2020-2026 (USD MILLION)
TABLE 48. REST OF ASIA PACIFIC 5G EQUIPMENT MARKET VALUE, BY COMPONENT, 2020-2026 (USD MILLION)
TABLE 49. REST OF WORLD 5G EQUIPMENT MARKET VALUE, BY END USER, 2020-2026 (USD MILLION)
TABLE 50. REST OF WORLD 5G EQUIPMENT MARKET VALUE, BY COMPONENT, 2020-2026 (USD MILLION)
TABLE 51. ERICSSON.: FINANCIALS
TABLE 52. ERICSSON.: PRODUCTS & SERVICES
TABLE 53. ERICSSON. : RECENT DEVELOPMENTS
TABLE 54. HUAWEI TECHNOLOGIES: FINANCIALS
TABLE 55. HUAWEI TECHNOLOGIES: PRODUCTS & SERVICES
TABLE 56. HUAWEI TECHNOLOGIES: RECENT DEVELOPMENTS
TABLE 57. NOKIA: FINANCIALS
TABLE 58. NOKIA: PRODUCTS & SERVICES
TABLE 59. NOKIA: RECENT DEVELOPMENTS
TABLE 60. NTT DOCOMO: FINANCIALS
TABLE 61. NTT DOCOMO: PRODUCTS & SERVICES
TABLE 62. NTT DOCOMO: RECENT DEVELOPMENTS
TABLE 63. QUALCOMM: FINANCIALS
TABLE 64. QUALCOMM: PRODUCTS & SERVICES
TABLE 65. QUALCOMM: RECENT DEVELOPMENTS
TABLE 66. SAMSUNG: FINANCIALS
TABLE 67. SAMSUNG: PRODUCTS & SERVICES
TABLE 68. SAMSUNG: RECENT DEVELOPMENTS
TABLE 69. SINGTEL: FINANCIALS
TABLE 70. SINGTEL: PRODUCTS & SERVICES
TABLE 71. SINGTEL: RECENT DEVELOPMENTS
TABLE 72. SK TELECOM.: FINANCIALS
TABLE 73. SK TELECOM.: PRODUCTS & SERVICES
TABLE 74. SK TELECOM.: RECENT DEVELOPMENTS
TABLE 75. TELENOR: FINANCIALS
TABLE 76. TELENOR: PRODUCTS & SERVICES
TABLE 77. TELENOR: RECENT DEVELOPMENTS
TABLE 78. HUAWEI.: FINANCIALS
TABLE 79. HUAWEI.: PRODUCTS & SERVICES
TABLE 80. HUAWEI.: RECENT DEVELOPMENTS
Research Framework
Infoholic Research works on a holistic 360° approach in order to deliver high quality, validated and reliable information in our market reports. The Market estimation and forecasting involves following steps:
- Data Collation (Primary & Secondary)
- In-house Estimation (Based on proprietary data bases and Models)
- Market Triangulation
- Forecasting

Market related information is congregated from both primary and secondary sources.
Primary sources
Involved participants from all global stakeholders such as Solution providers, service providers, Industry associations, thought leaders etc. across levels such as CXOs, VPs and managers. Plus, our in-house industry experts having decades of industry experience contribute their consulting and advisory services.
Secondary sources
Include public sources such as regulatory frameworks, government IT spending, government demographic indicators, industry association statistics, and company publications along with paid sources such as Factiva, OneSource, Bloomberg among others.
![]()


