
Graph Analytics Market segmented by Deployment Mode (On-premises and Cloud), Application (Customer Analytics, Risk and Compliance Management, Recommendation Engines, Route Optimization, Fraud Detection, and Others), Vertical, Organization Size, Component (Solutions and services), and Geography – Global Drivers, Restraints, Opportunities, Trends, and Forecast up to 2026
- September, 2020
- Domain: ICT - Social, Mobile, Analytics & Cloud (SMAC)
- Get Free 10% Customization in this Report
Graph analytics refers to network analysis, which is a systematic tool used to ascertain the direction and strength of the relationship between parameters in a graph. Graph analytics is rapidly being deployed for analytics work. This analysis is widely being utilized for social network influencer analysis. This software is used by marketing managers to spot out their prospective targets for marketing activities to buy products and services as well as used for the financial frauds such as money laundering. Growing preference for low-latency in query analyzing and incorporating technologies such as artificial intelligence, the internet of things, and blockchain are the aspects that are propelling the market growth. Graph Analytics Market is predicted to grow at a CAGR of 33.3% with a value expecting to reach $4,367.41 million by 2026.
Research Methodology:
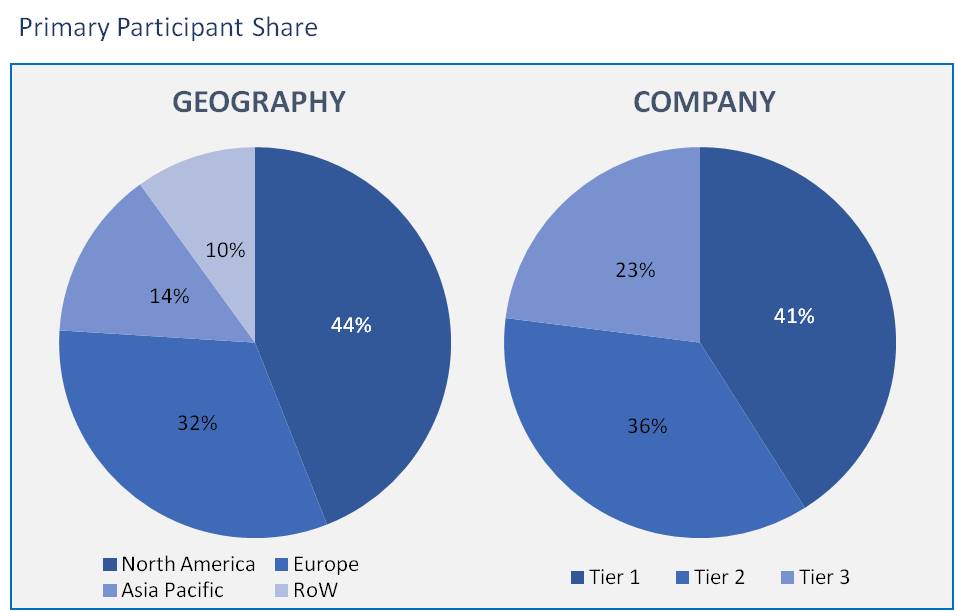
The graph analytics market has been analyzed by utilizing the optimum combination of secondary sources and in-house methodology, along with an irreplaceable blend of primary insights. The real-time assessment of the market is an integral part of our market sizing and forecasting methodology. Our industry experts and panel of primary participants have helped in compiling relevant aspects with realistic parametric estimations for a comprehensive study. The participation share of different categories of primary participants is given below:
Market categories based on Deployment Mode:
- On-premises
- Cloud
Market categories based on Application:
- Customer Analytics
- Risk and Compliance Management
- Recommendation Engines
- Route Optimization
- Fraud Detection
- Others
Market segments based on Vertical:
- Banking, Financial Services, and Insurance
- Retail and eCommerce
- Telecom
- Healthcare and Life Sciences
- Government and Public Sector
- Manufacturing
- Transportation and Logistics
- Others
Market segments based on Organization Size:
- Large Enterprises
- Small and Medium-Sized Enterprises
Market categories based on Component:
- Solutions
- Software Tools
- Platform
- Services
- Consulting
- System Integration
- Support and Maintenance
Market classification based on Geography:
- North America
- Europe
- Asia Pacific
- Rest of the World
As per the deployment mode, the market is bifurcated into on-premise and cloud the cloud deployment is the most adopted segment due to its advantages. In cloud deployment mode, the generated data is easily maintained, incurs low-cost, and features high expandability.
As per the application, the route optimization segment is having the largest share in the graph analytics market. Due to the rising need for discovering the fastest and secure and effective route in verticals, for instance, in the supply chain, optimize route planning assists in brands to meet customer demands better.
As in the vertical market, the healthcare and life sciences segment is anticipated to have the largest share in the graph analytics market. Because of the high demand for minimizing fraud in the healthcare data, aiming for better patient experience and delivering customize treatment in real-time graph analytics.
Large enterprises in the organization type segment are widely deploying the graph analytics solutions compared to the small and medium-sized enterprises. This is because the requirement of this enterprise to control the huge volume of data happening to generate from the various business entities and convert it into executable insights
In the component market segmentation, the market is segregated into solutions and services component. The services segment has a high demand, and the services segment is further segregated among consulting, system integration, and support & maintenance. The demand for services segment is ascribed to the increasing adoption of software tools and platforms, which results in demand for pre and post-adoption of services.
In the regional market, the North American region is considered to dominate the graph analytics market. It is due to the vital developments that are observed in this region, the increasing utilization of the data technology, and rapidly increasing data volume in the verticals.
Globally, the graph analytics is widely used due to its cost-effective benefits such as to detect cybercrimes, applying to social networks as to keep track of statistics and to discover influencers, and to enhance the logistics in the manufacturing and transportation industries. The above benefits of graph analytics are projected to drive market growth. Although, few factors such as the dearth of technical skilled resource area likely to hamper the market growth.
Oracle, Microsoft, AWS, Neo4j, IBM TigerGraph, DataStax, Franz, TIBCO Software, Cray, Lynx Analytics, Linkurious, Teradata, Graphistry, Dataiku, Tom Sawyer Software, Objectivity, Kineviz, and Expero. These are the few market players which are dominating the graph analytics market.
Moreover, the Graph Analytics market is anticipated to reach the rate of the highest CAGR. The graph analytics are majorly adopted to identify the frauds or unlawful by the national intelligence agency. The graph analytics market report gives insights into drivers, opportunities, and restraints.
- This research assists the new entrants in this market with information on the adjacent expectations of the revenue for the overall graph analytics market and the segments.
- This report will assist shareholders in understanding the competitive edge and obtaining in-depth analysis to place their businesses better
- The graph analytics market report further helps the shareholders to project perfect market strategies.
1. Executive Summary
2. Vertical Outlook
2.1. Vertical Overview
2.2. Vertical Trends
3. Market Snapshot
3.1. Total Adressable Market
3.2. Segment Addressable Market
3.2.1. PEST Analysis
3.2.2. Porter Five Forces
3.3. Related Markets
3.4. Ecosystem
4. Market Outlook
4.1. Overview
4.1.1. Market Evolution
4.2. Market Trends and Impact
4.3. Pricing Analysis
4.4. Market Segmentation
4.5. Market Dynamics
4.5.1. Drivers
4.5.2. Restraints
4.5.3. Opportunities
4.6. DRO - Impact Analysis
5. Deployment Mode: Market Size & Analysis
5.1. Overview
5.2. On-premises
5.3. Cloud
6. Application: Market Size & Analysis
6.1. Overview
6.2. Customer Analytics
6.3. Risk and Compliance Management
6.4. Recommendation Engines
6.5. Route Optimization
6.6. Fraud Detection
6.7. Others
7. Vertical: Market Size & Analysis
7.1. Overview
7.2. Banking, Financial Services, and Insurance
7.3. Retail and eCommerce
7.4. Telecom
7.5. Healthcare and Life Sciences
7.6. Government and Public Sector
7.7. Manufacturing
7.8. Transportation and Logistics
7.9. Others
8. Organization Size: Market Size & Analysis
8.1. Overview
8.2. Large Enterprises
8.3. Small and Medium-Sized Enterprises
9. Component: Market Size & Analysis
9.1. Overview
9.2. Solutions
9.2.1. Software Tools
9.2.2. Platform
9.3. Services
9.3.1. Consulting
9.3.2. System Integration
9.3.3. Support and Maintenance
10. Geography: Market Size & Analysis
10.1. Overview
10.2. North America
10.3. Europe
10.4. Asia Pacific
10.5. Rest of the World
11. Competitive Landscape
11.1. Competitor Comparison Analysis
11.2. Market Developments
11.2.1. Mergers and Acquisitions, Legal, Awards, Partnerships
11.2.2. Product Launches and execution
12. Vendor Profiles
12.1. MICROSOFT
12.1.1. Overview
12.1.2. Business Units
12.1.3. Geographic Revenue
12.1.4. Product Offerings
12.1.5. Developments
12.1.6. Business Strategy
12.2. IBM
12.2.1. Overview
12.2.2. Business Units
12.2.3. Geographic Revenue
12.2.4. Product Offerings
12.2.5. Developments
12.2.6. Business Strategy
12.3. AWS
12.3.1. Overview
12.3.2. Business Units
12.3.3. Geographic Revenue
12.3.4. Product Offerings
12.3.5. Developments
12.3.6. Business Strategy
12.4. ORACLE
12.4.1. Overview
12.4.2. Business Units
12.4.3. Geographic Revenue
12.4.4. Product Offerings
12.4.5. Developments
12.4.6. Business Strategy
12.5. NEO4J
12.5.1. Overview
12.5.2. Business Units
12.5.3. Geographic Revenue
12.5.4. Product Offerings
12.5.5. Developments
12.5.6. Business Strategy
12.6. TIGERGRAPH
12.6.1. Overview
12.6.2. Business Units
12.6.3. Geographic Revenue
12.6.4. Product Offerings
12.6.5. Developments
12.6.6. Business Strategy
12.7. CRAY
12.7.1. Overview
12.7.2. Business Units
12.7.3. Geographic Revenue
12.7.4. Product Offerings
12.7.5. Developments
12.7.6.
12.7.7. Business Strategy
12.8. DATASTAX
12.8.1. Overview
12.8.2. Business Units
12.8.3. Geographic Revenue
12.8.4. Product Offerings
12.8.5. Developments
12.8.6. Business Strategy
12.9. TERADATA
12.9.1. Overview
12.9.2. Business Units
12.9.3. Geographic Revenue
12.9.4. Product Offerings
12.9.5. Developments
12.9.6. Business Strategy
12.10. TIBCO SOFTWARE
12.10.1. Overview
12.10.2. Business Units
12.10.3. Geographic Revenue
12.10.4. Product Offerings
12.10.5. Developments
12.10.6. Business Strategy
13. Companies to Watch
13.1. LYNX ANALYTICS
13.1.1. Overview
13.1.2. Market
13.1.3. Business Strategy
13.2. LINKURIOUS
13.2.1. Overview
13.2.2. Market
13.2.3. Business Strategy
13.3. GRAPHISTRY
13.3.1. Overview
13.3.2. Market
13.3.3. Business Strategy
13.4. OBJECTIVITY
13.4.1. Overview
13.4.2. Market
13.4.3. Business Strategy
13.5. DATAIKU
13.5.1. Overview
13.5.2. Market
13.5.3. Business Strategy
13.6. TOM SAWYER SOFTWARE
13.6.1. Overview
13.6.2. Market
13.6.3. Business Strategy
13.7. TOM SAWYER SOFTWARE.
13.7.1. Overview
13.7.2. Market
13.7.3. Business Strategy
13.8. KINEVIZ
13.8.1. Overview
13.8.2. Market
13.8.3. Business Strategy
13.9. FRANZ
13.9.1. Overview
13.9.2. Market
13.9.3. Business Strategy
13.10. EXPERO
13.10.1. Overview
13.10.2. Market
13.10.3. Business Strategy
14. Analyst Opinion
15. Annexure
15.1. Report Scope
15.2. Market Definitions
15.3. Research Methodology
15.3.1. Data Collation and In-house Estimation
15.3.2. Market Triangulation
15.3.3. Forecasting
15.4. Report Assumptions
15.5. Declarations
15.6. Stakeholders
15.7. Abbreviations
Research Framework
Infoholic research works on a holistic 360° approach in order to deliver high quality, validated and reliable information in our market reports. The Market estimation and forecasting involves following steps:
- Data Collation (Primary & Secondary)
- In-house Estimation (Based on proprietary data bases and Models)
- Market Triangulation
- Forecasting

Market related information is congregated from both primary and secondary sources.
Primary sources
involved participants from all global stakeholders such as Solution providers, service providers, Industry associations, thought leaders etc. across levels such as CXOs, VPs and managers. Plus, our in-house industry experts having decades of industry experience contribute their consulting and advisory services.
Secondary sources
include public sources such as regulatory frameworks, government IT spending, government demographic indicators, industry association statistics, and company publications along with paid sources such as Factiva, OneSource, Bloomberg among others.
![]()